
Understanding
Shape the future of Tempe! Review the materials on this page, then take our short survey and provide location-specific comments on a map!Understanding today for a better tomorrow.
Tempe is committed to creating a safe, efficient, and accessible Multimodal refers to all the modes people and goods use to get around (e.g., automobiles, transit, bicycles, walking/rolling, and micromobility such as scooters). system that easily connects people in Tempe and to the region along complete, functional, and attractive streets and paths.
The Tempe General Plan 2050 Vision for Tempe focuses on mobility. It envisions a transportation system that is physically accessible by multiple modes of transportation, especially transit, walking, biking, and micro-mobility options. This vision includes neighborhoods that are walkable, pleasant and safe, and connected within a 20-minute walk, bike or transit ride; supporting a high quality of life and sustainability; and making Tempe a transportation leader in the region.
The overarching goal of the Tempe Transportation Plan 2050 is to ensure a balanced, future-ready transportation network for people, goods, and services.

Did you know?
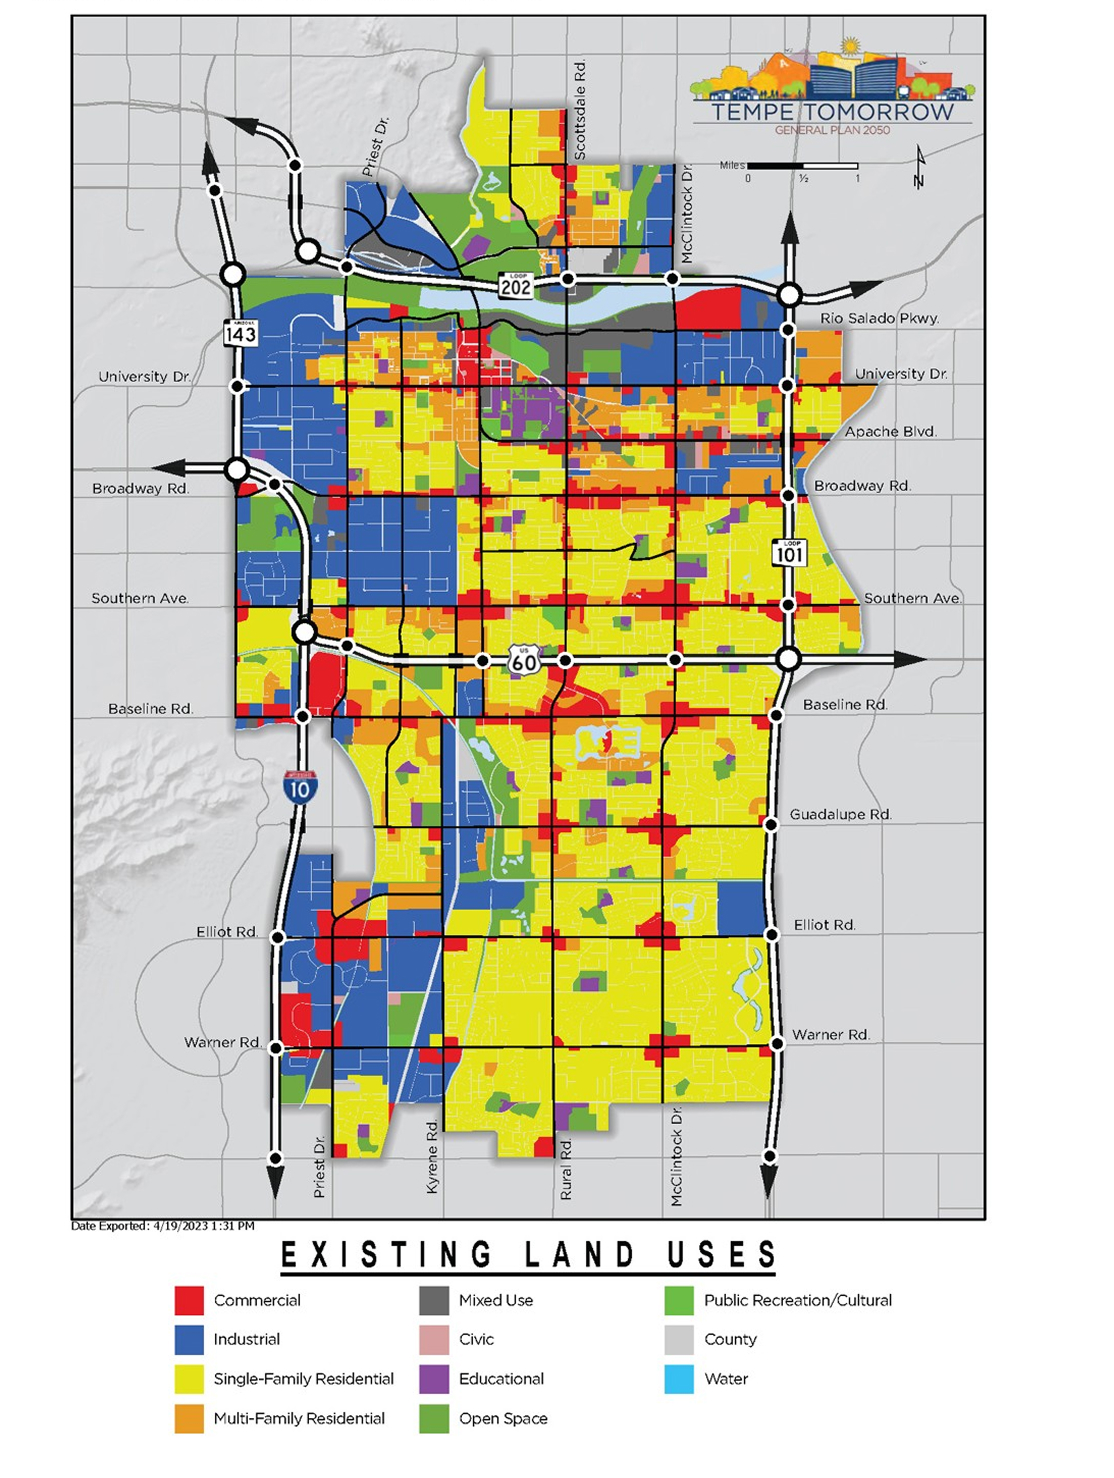
Over 22% of Tempe’s land area is public space: 17% is road/trail/sidewalk right-of-way and 5% are parks and amenities.
Tempe Today
Tempe is a dynamic city located in the heart of the Phoenix metropolitan area of central Arizona. Tempe is recognized for its commitment to a high quality of life for its residents, a strong employment and innovation center, and an authentic walkable downtown.
As one of the most densely populated and historic communities in the Valley, Tempe has developed a transportation system to meet the diverse needs of the community. Tempe’s fully developed grid street system, local transit circulators and regional bus system, Light Rail Transit and the region’s first Modern Streetcar is complemented with the Valley’s most robust on-street bicycle network and off-street multi-use path system.
Tempe's Transportation System
Streets provide connections to the places that people go to school, work, and shop. Tempe is a leader in planning, designing, and constructing street corridors that accommodate all modes of travel for all types of users. Although Tempe’s streets are multimodal, information on this page is organized by mode to discuss the characteristics of each.
- 190K Total population of Tempe
- 532 Total centerline miles of streets
- 7.1M Transit Boardings in FY25
- 90% Percent of streets that include sidewalks
- 4% Residents who bike to work
Did you know?
The US Census indicates more people work in Tempe than live here, continuing a trend of more than 20 years. Every day, nearly 230,000 employees commute into Tempe and 63,000 Tempe residents commute out of Tempe!
Our Growing Community
Tempe continues to evolve and grow. The Tempe Tomorrow General Plan 2050 identifies eight Innovation Hubs and Growth Areas where a concentration of development and a mix of uses are planned, and population and employment are forecast to grow. Population and employment projections for the region are adopted by the Maricopa Association of Governments (MAG) and provide the basis for forecasting future transportation needs (projections are subject to adjustments in the future).
Population
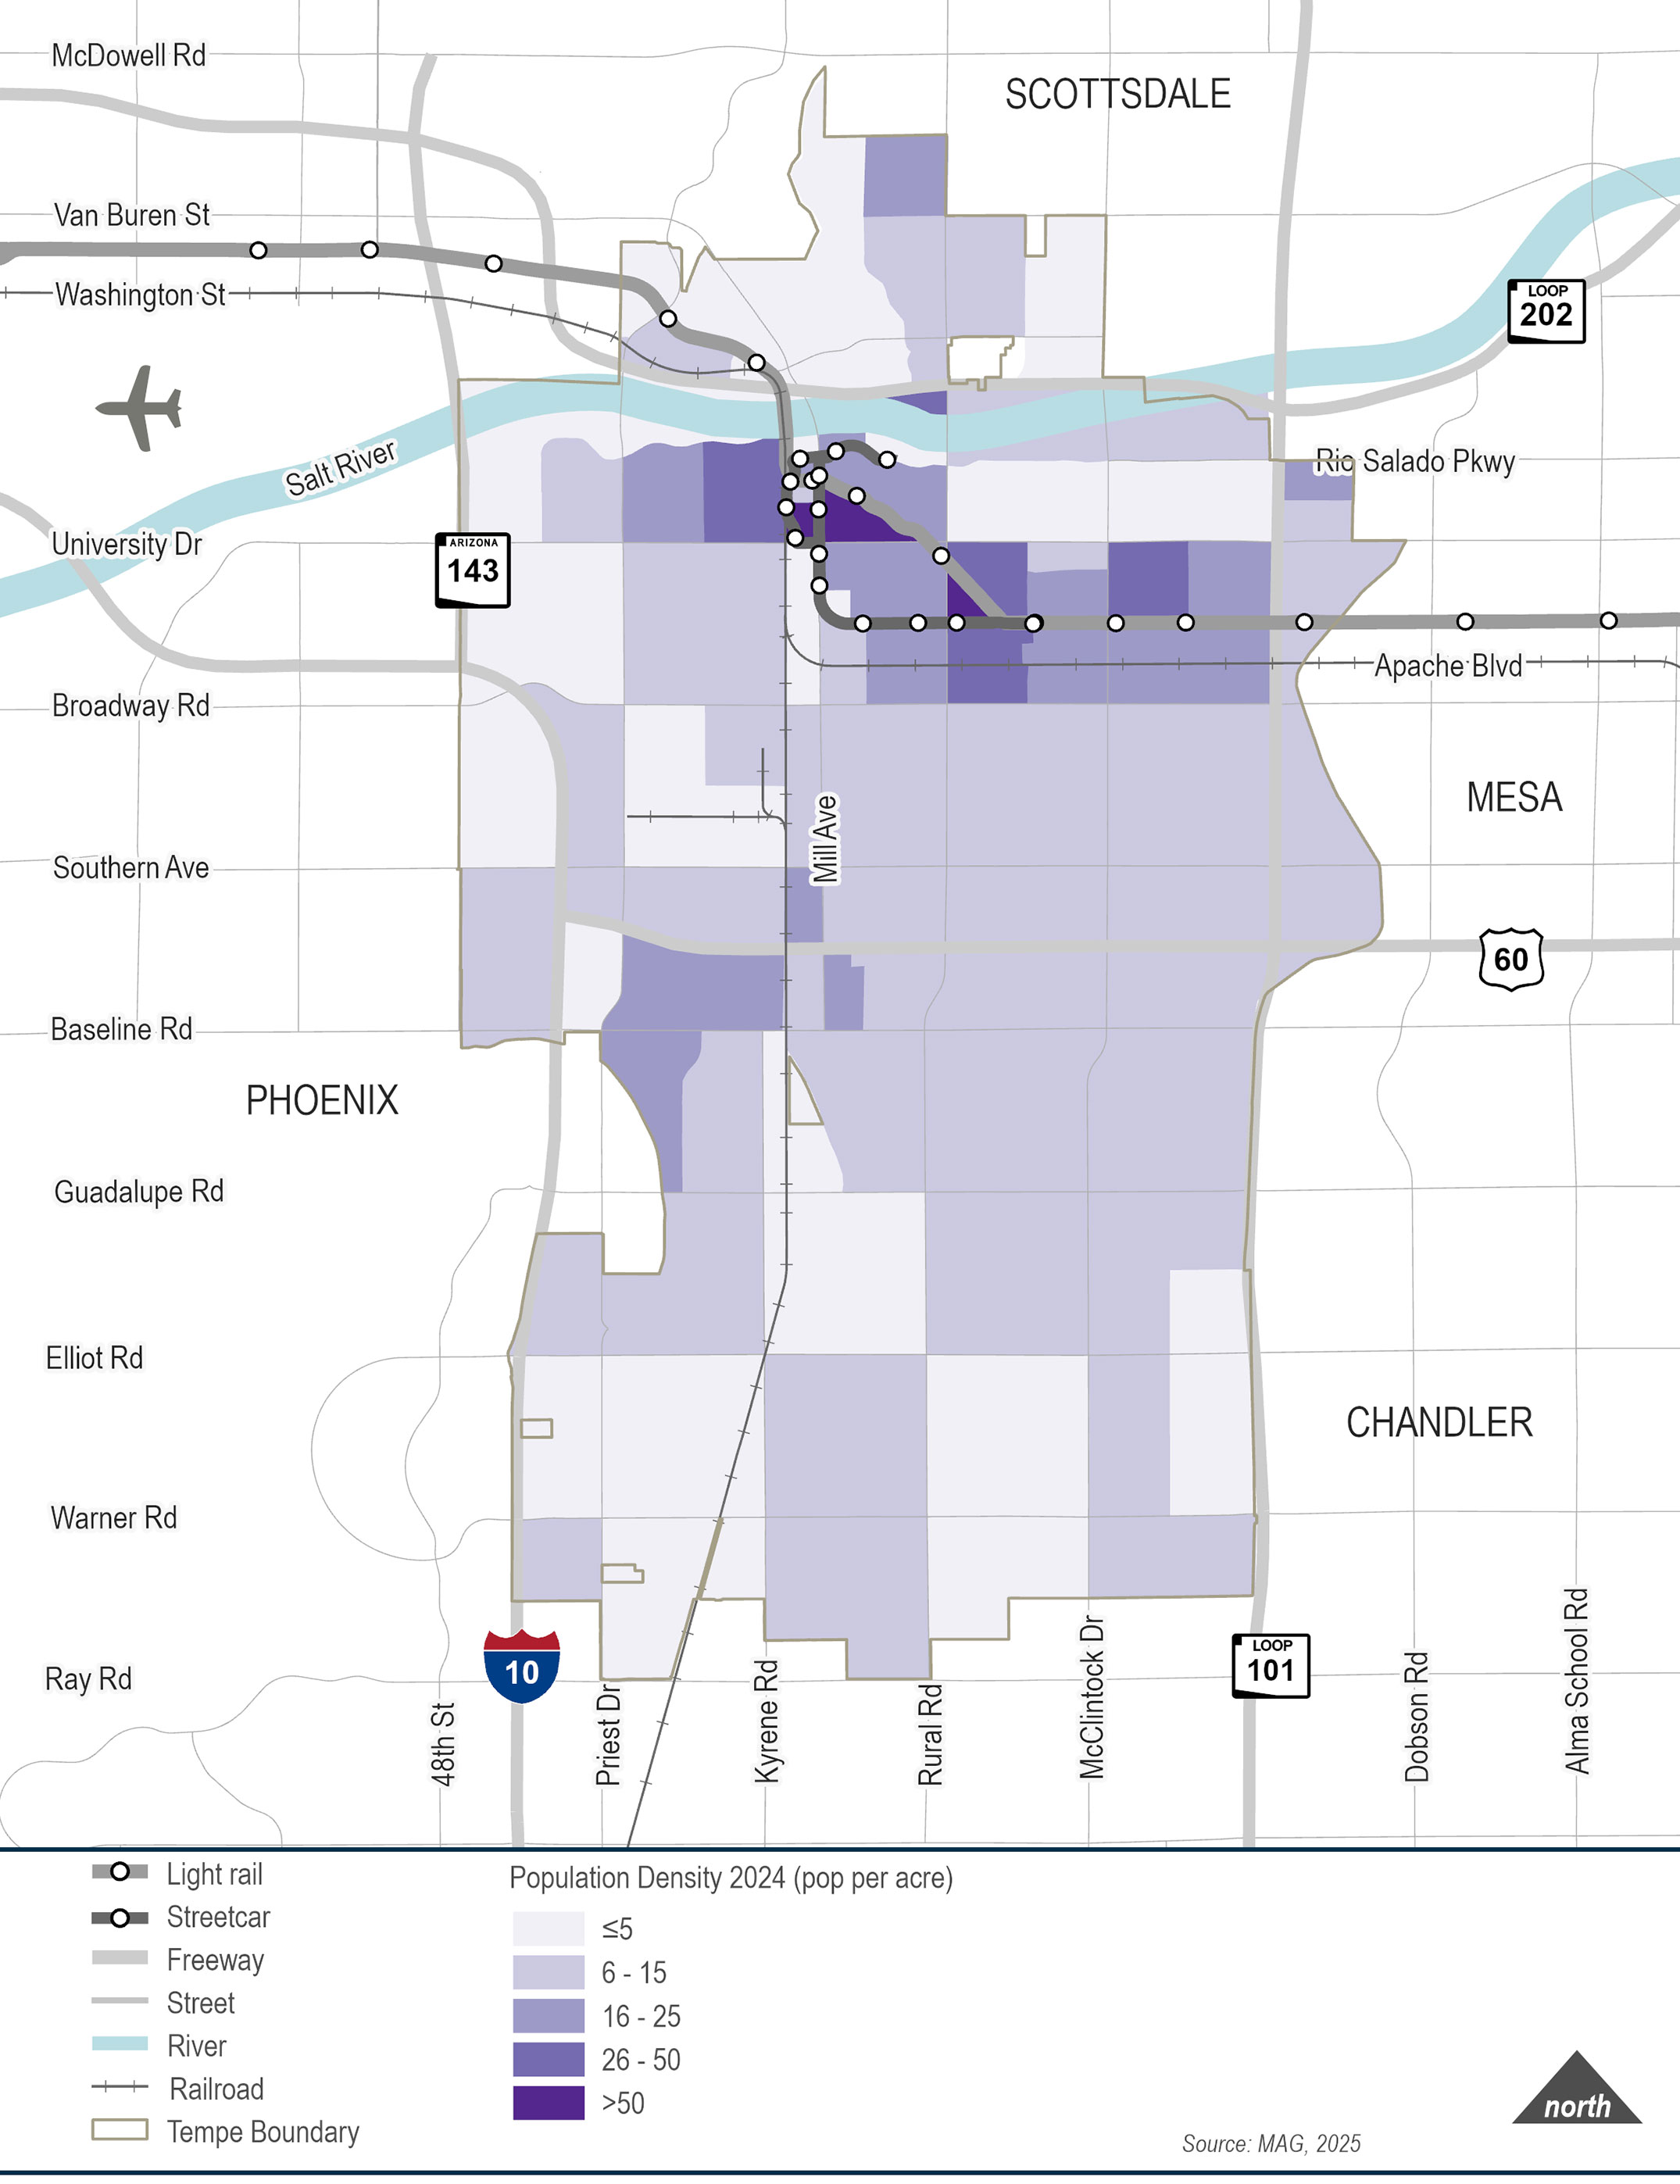
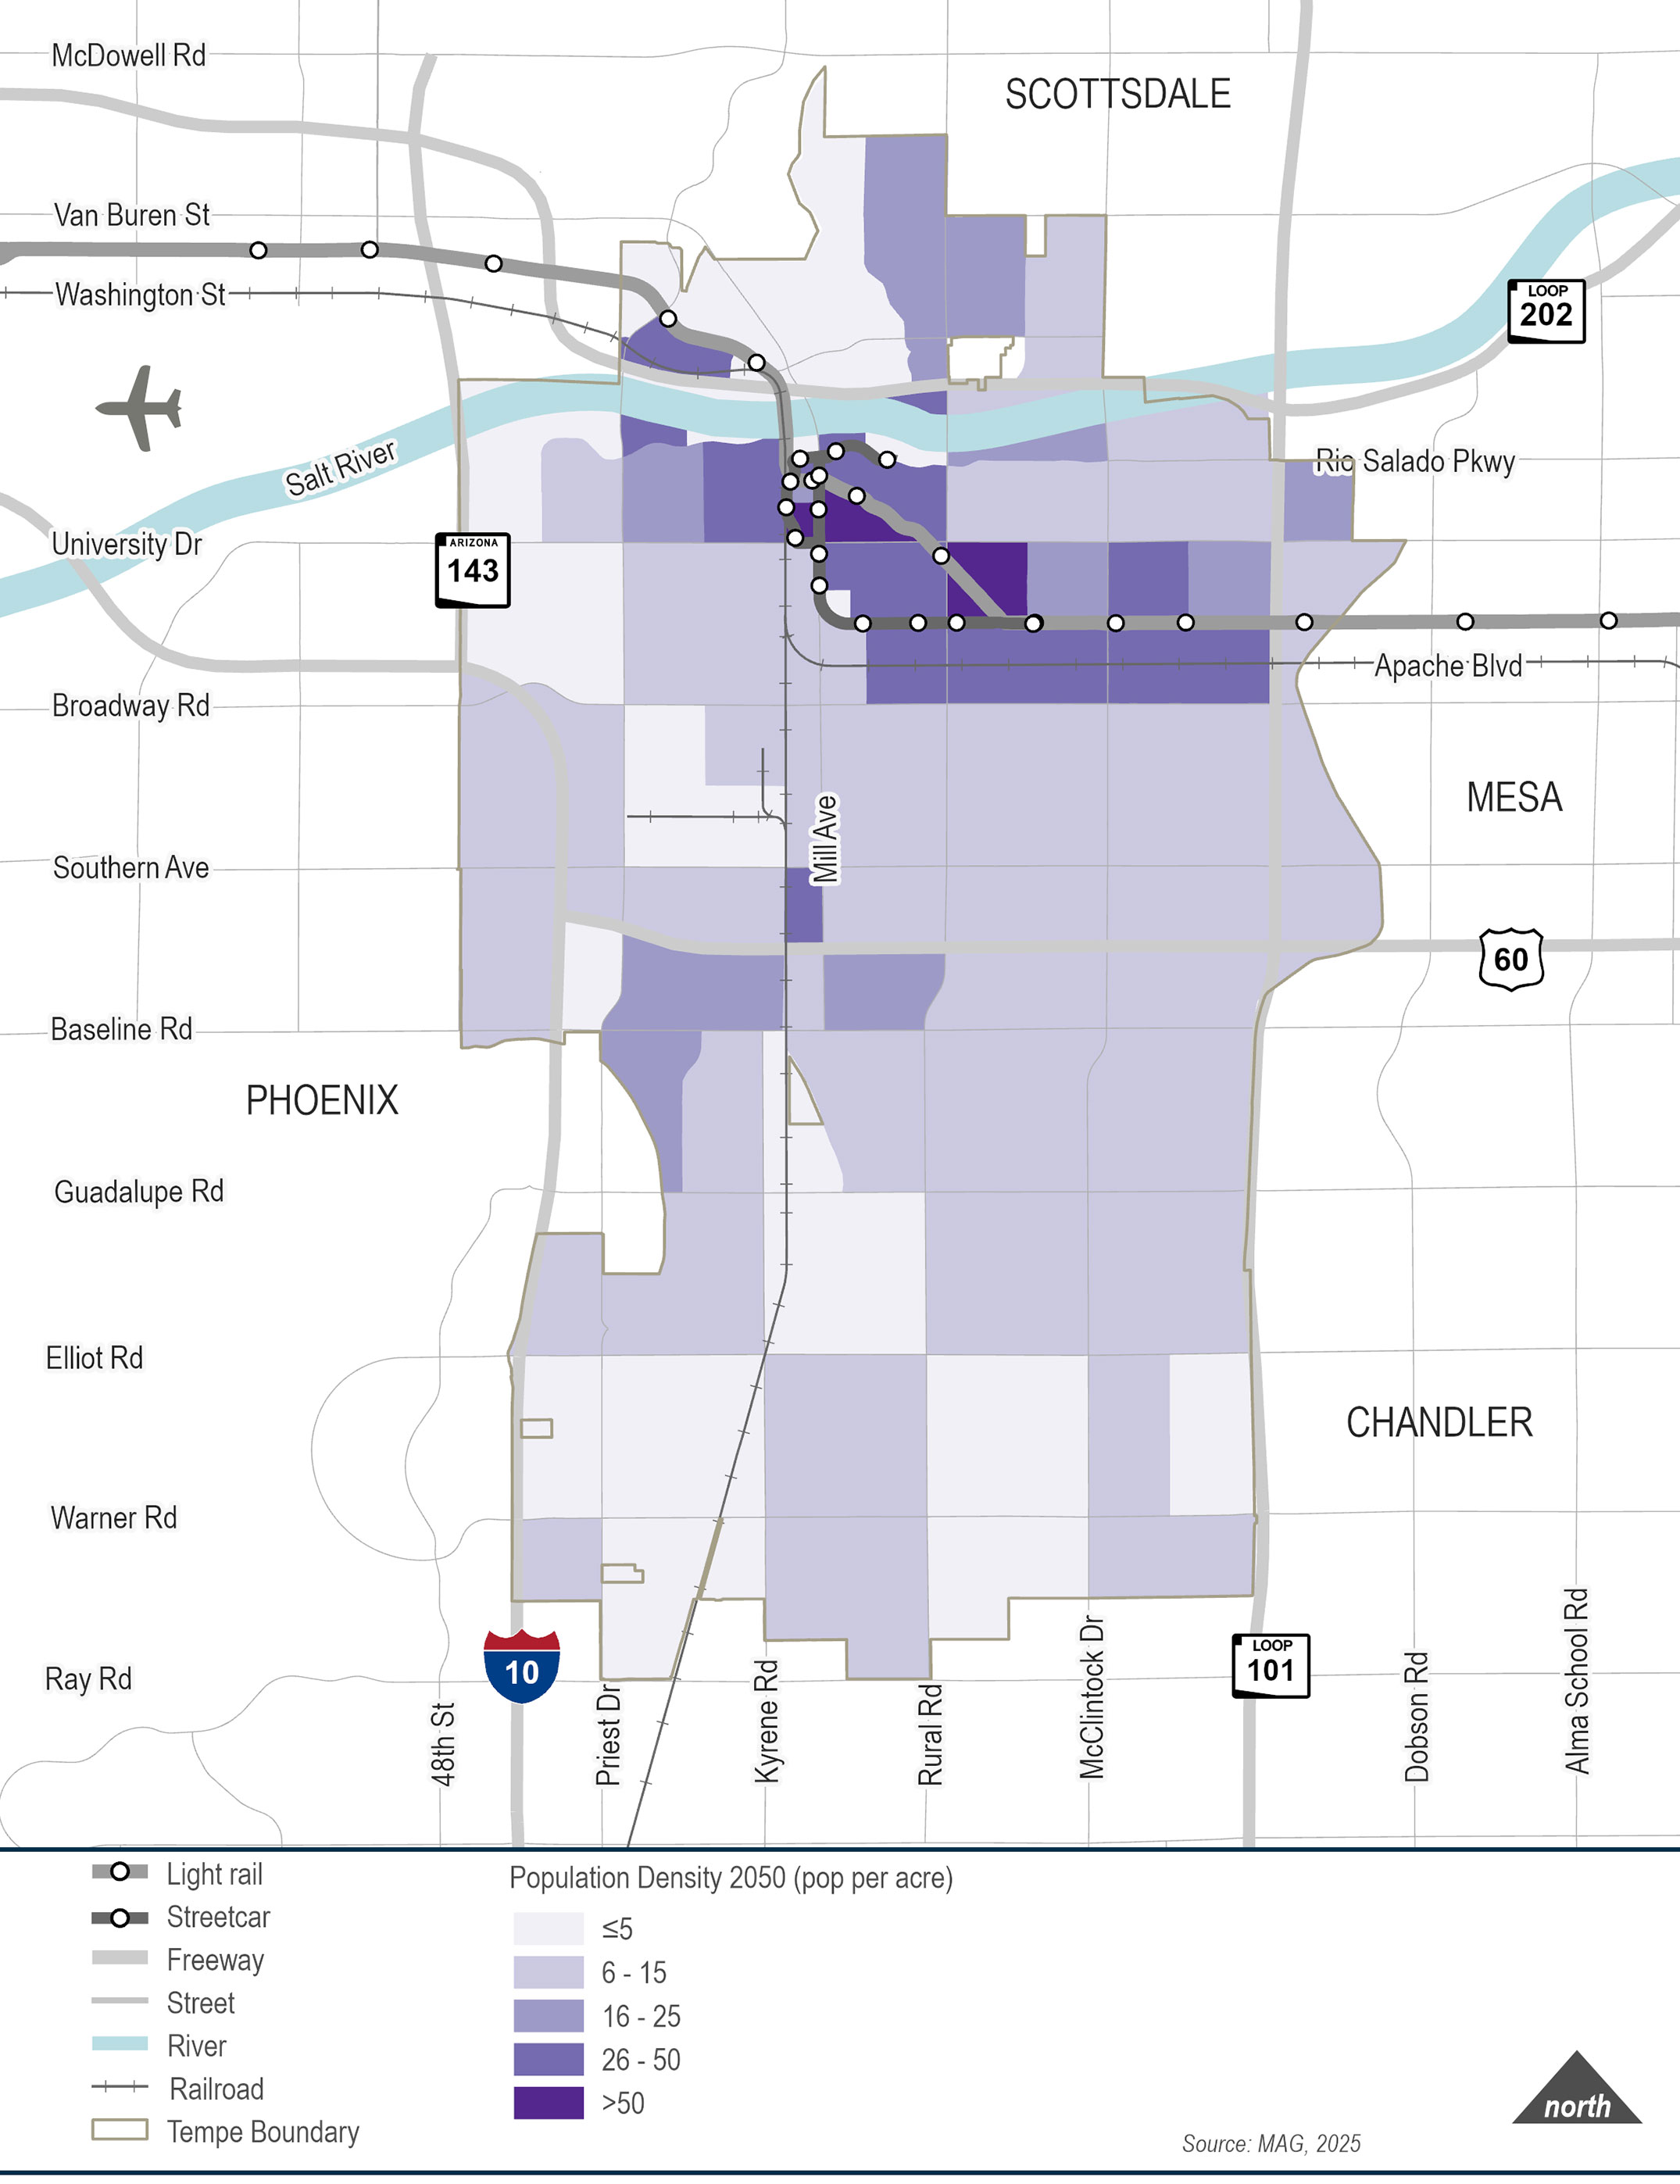
Tempe’s population is projected to grow to over 250,000 by 2050, an increase of over 33 percent from today. While significant, this growth is less than the MAG region’s population growth over the same period of 40 percent (from about 5.1 million today to 7.1 million by 2050).
Move the slider left and right to see how the population of Tempe is expected to change between now and 2050.
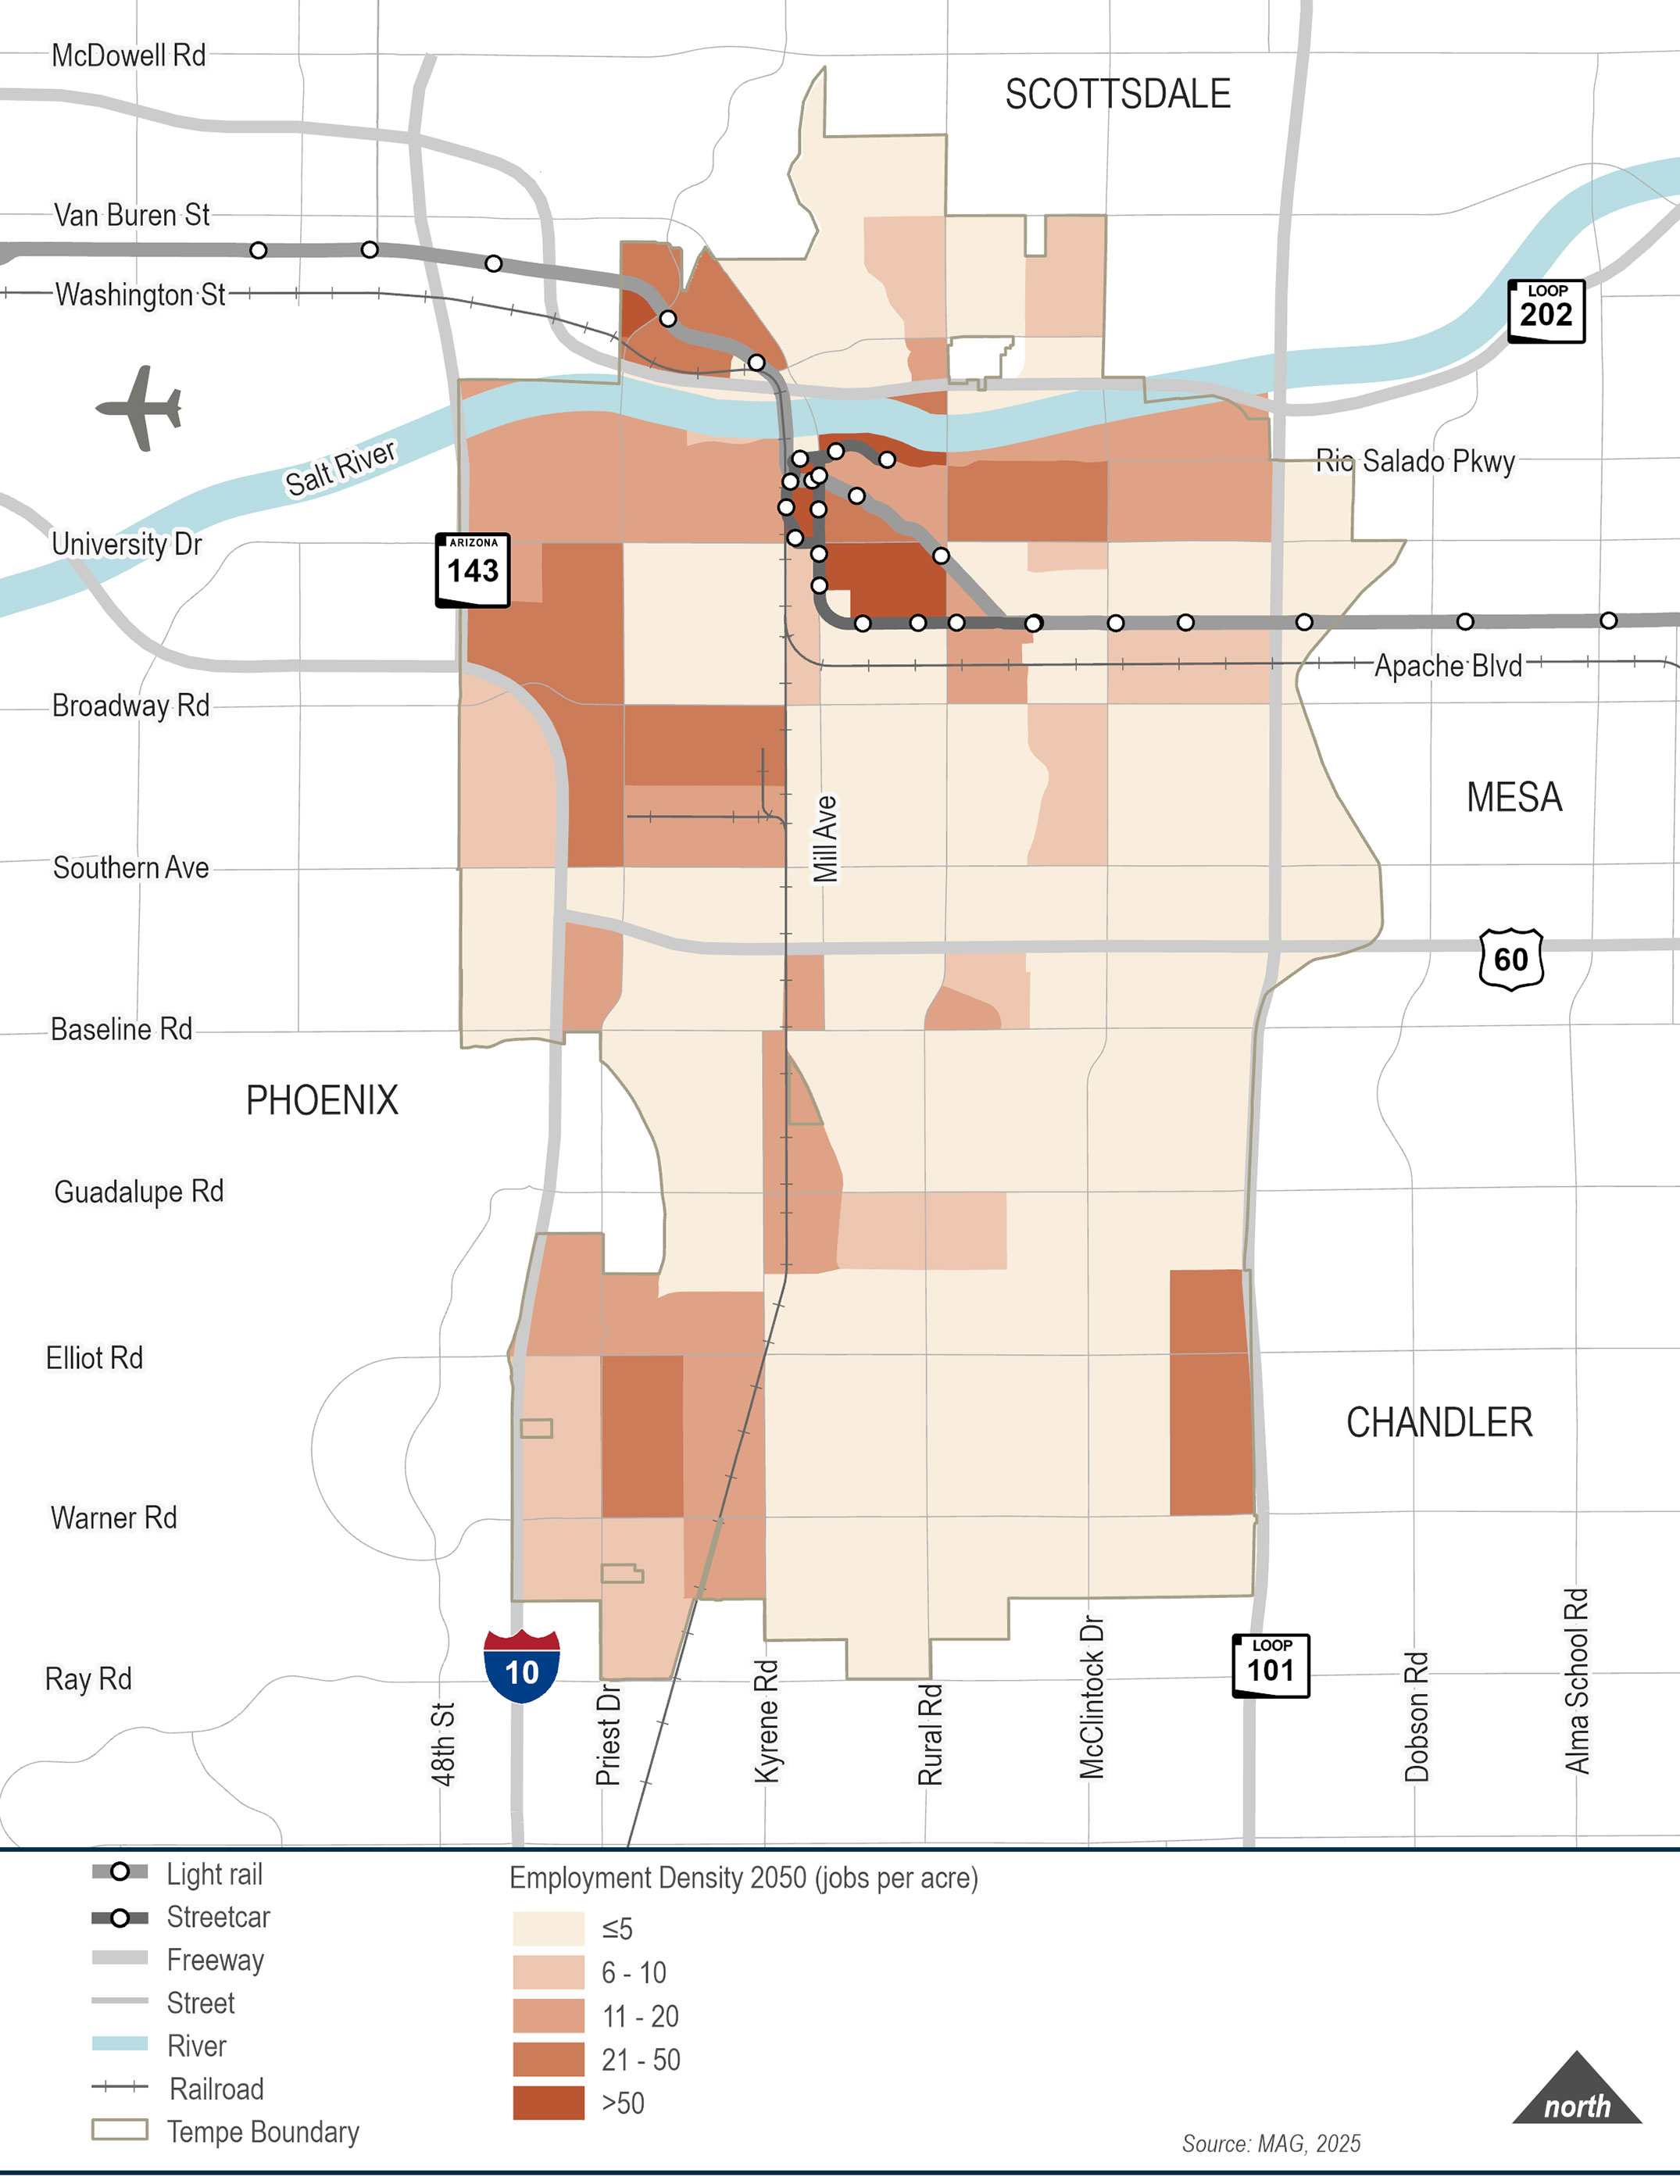
Employment
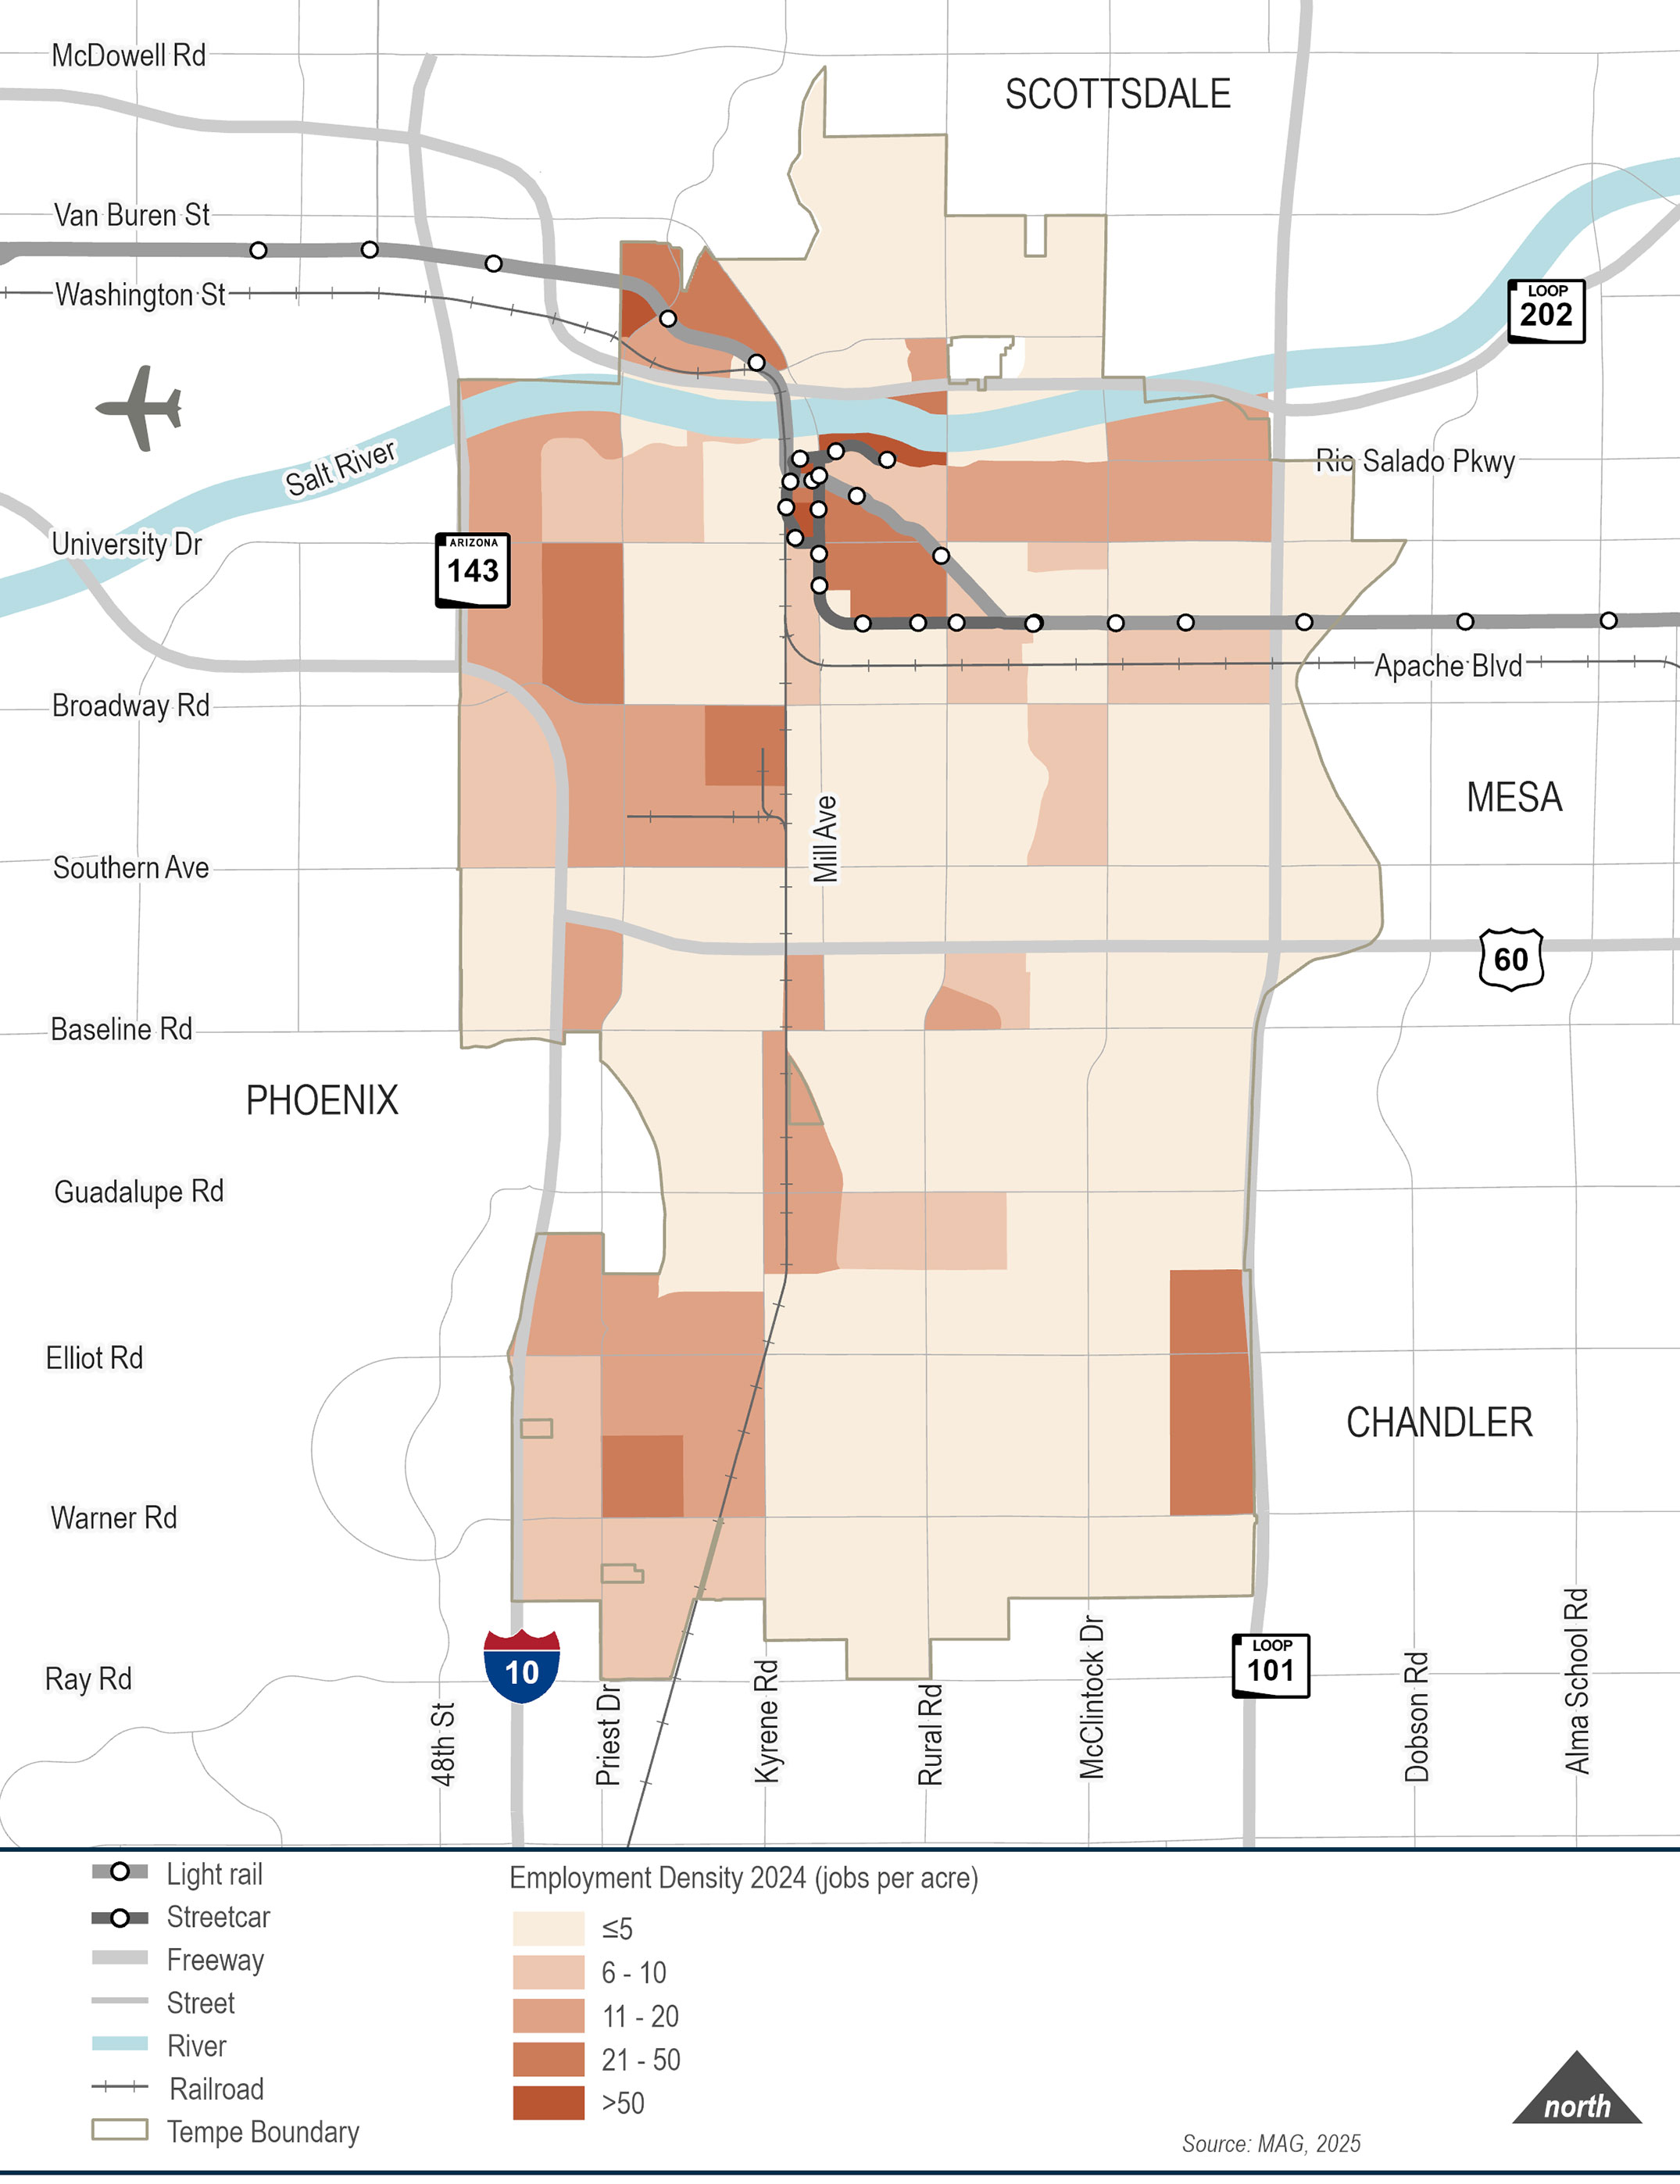
Tempe’s diverse employment base provides jobs for people living throughout the Valley. The largest percentage of employment increases are projected to occur within one mile of the light rail corridor, near the Broadway Curve of I-10, and along Loop 101 between Elliot Road and Warner Road.
Move the slider left and right to see how the density of jobs across Tempe is expected to change between now and 2050.
Traffic
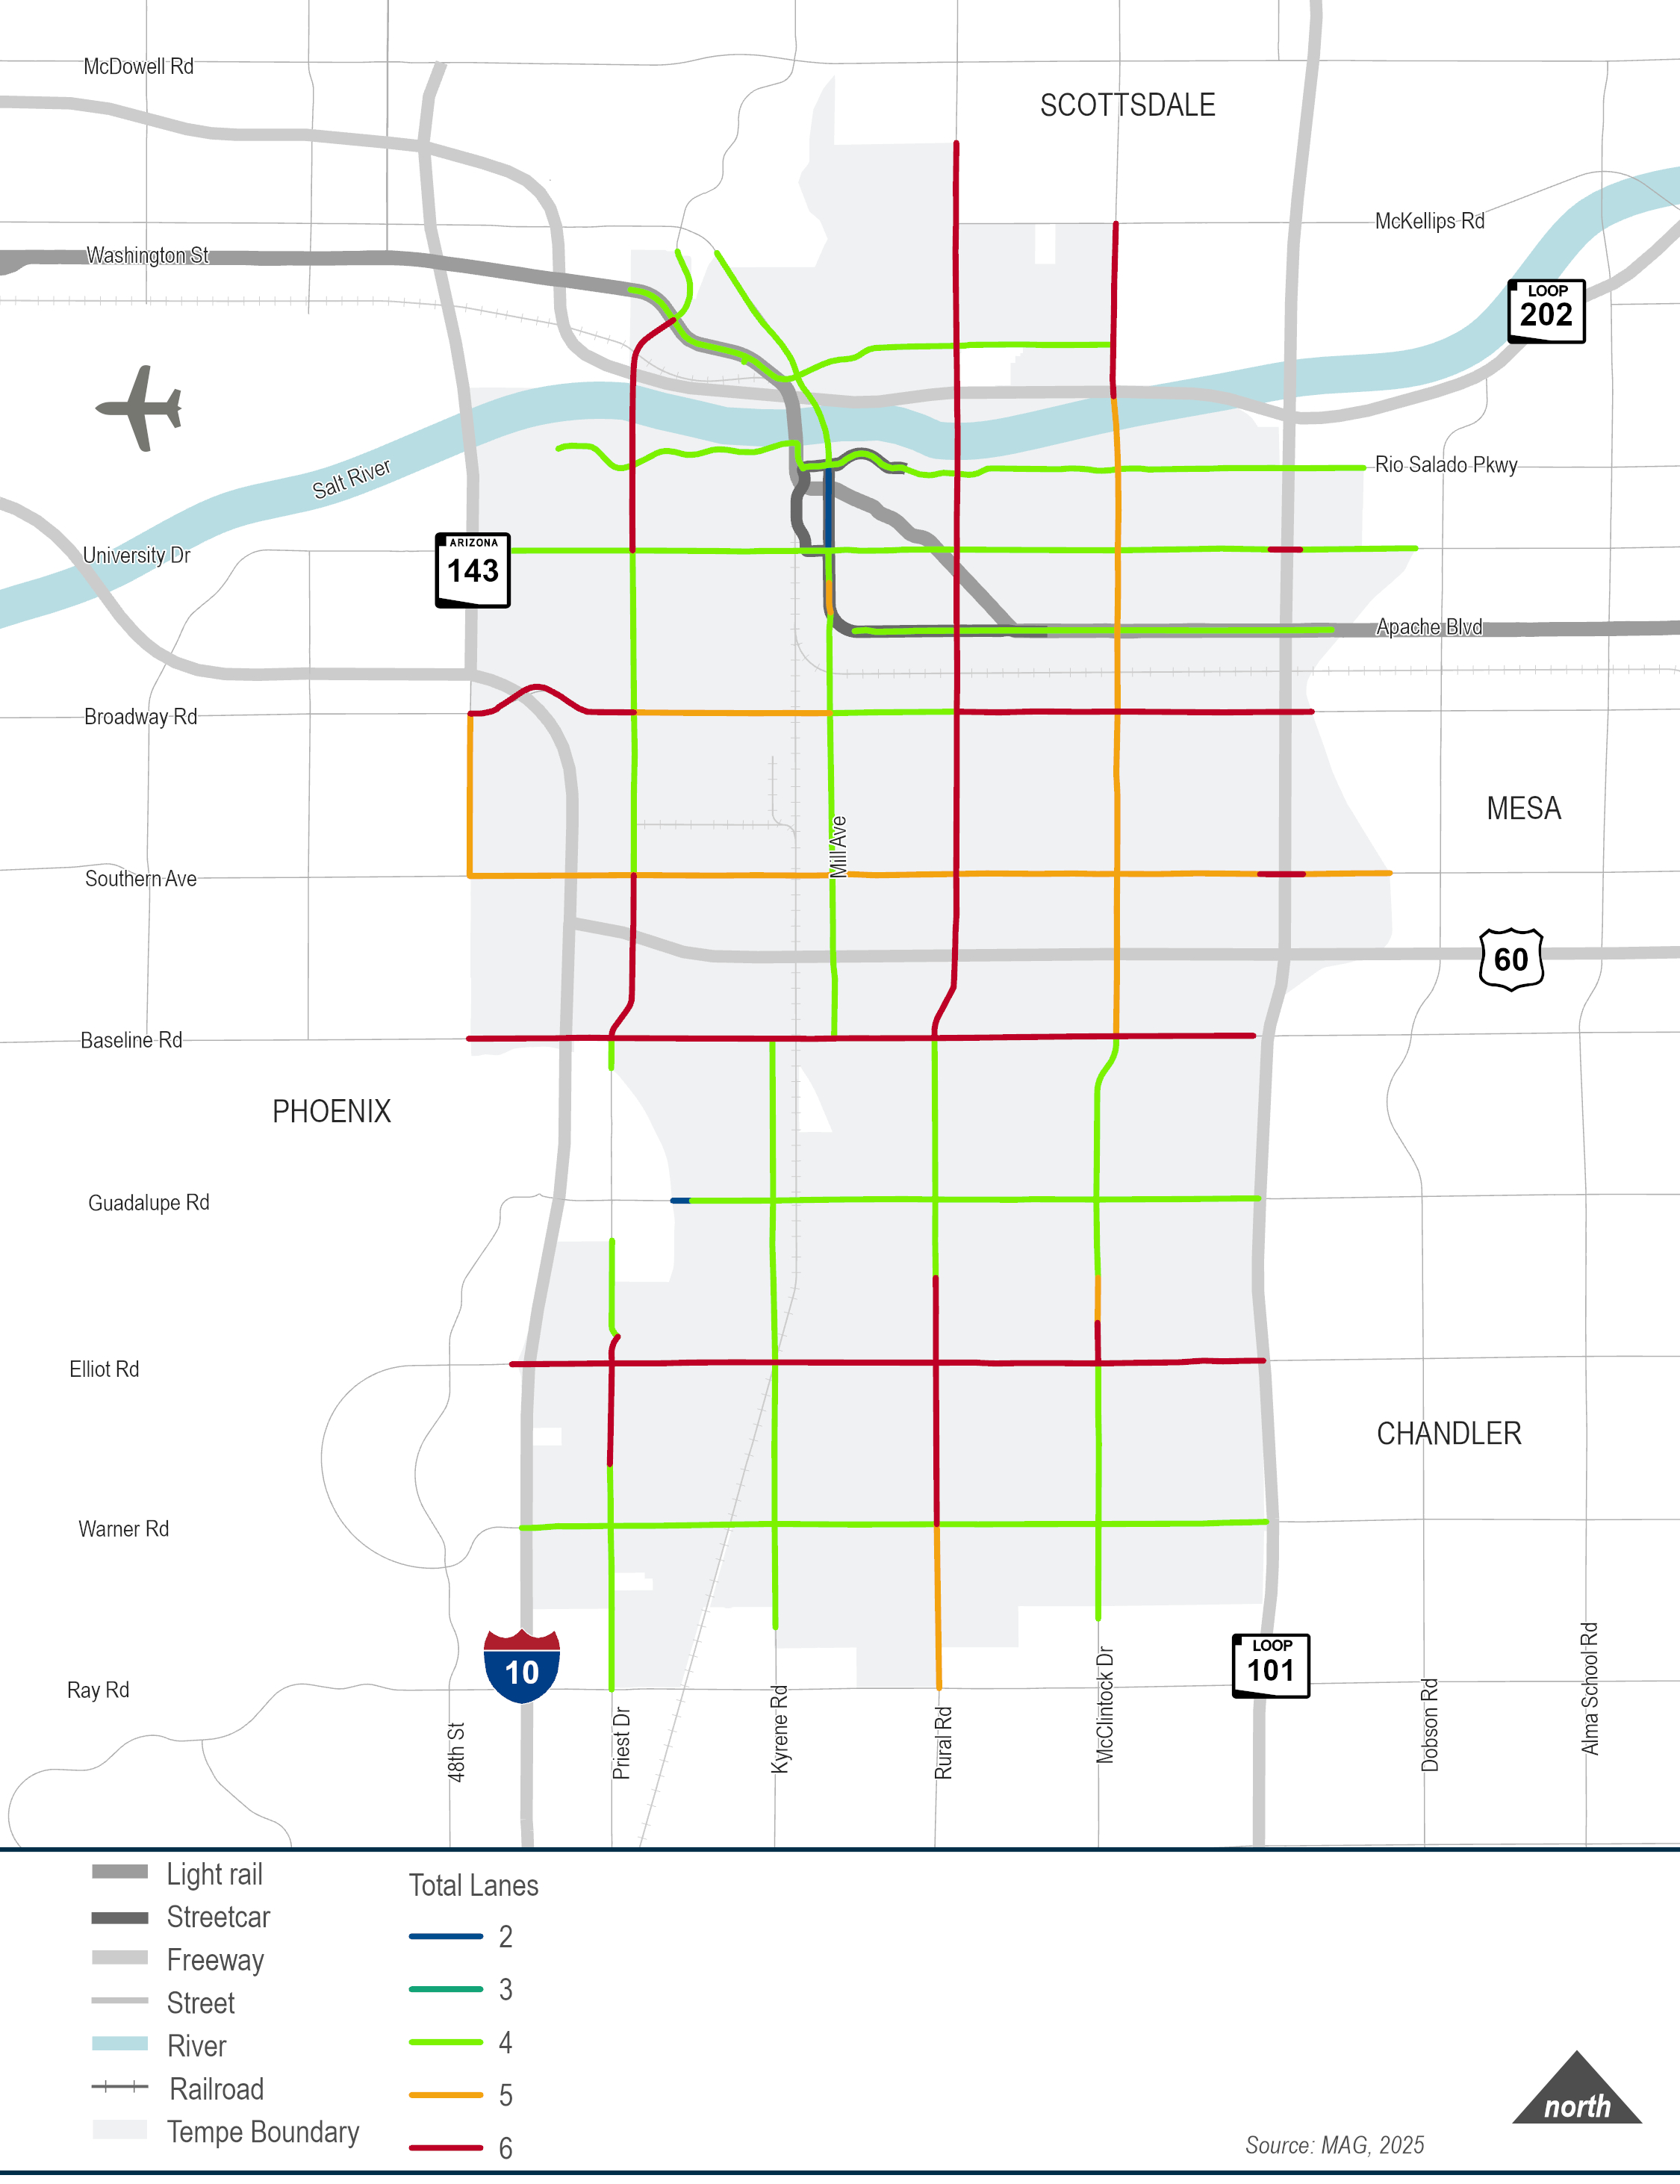
Numerous factors, including the City’s location in the center of the Phoenix metropolitan area, contribute to the traffic on the City’s streets. While an increasing number of trips are served by transit, walking, rolling, and bicycling in the City—vehicles provide the primary mode of travel for residents of Tempe.
Travel lanes provide roadway capacity. Numerous factors influence the capacity of a roadway lane including:
- the number of travel lanes
- traffic volume
- density of turning movements (driveways, cross-streets)
- traffic controls
- driver behavior
- the presence of pedestrians
- weather conditions
Traffic volume varies throughout the day, and year, with the heaviest volumes occurring during the afternoons. The COVID-19 pandemic presented a significant disruption to transportation; today traffic volumes have returned to near-pre-pandemic levels.
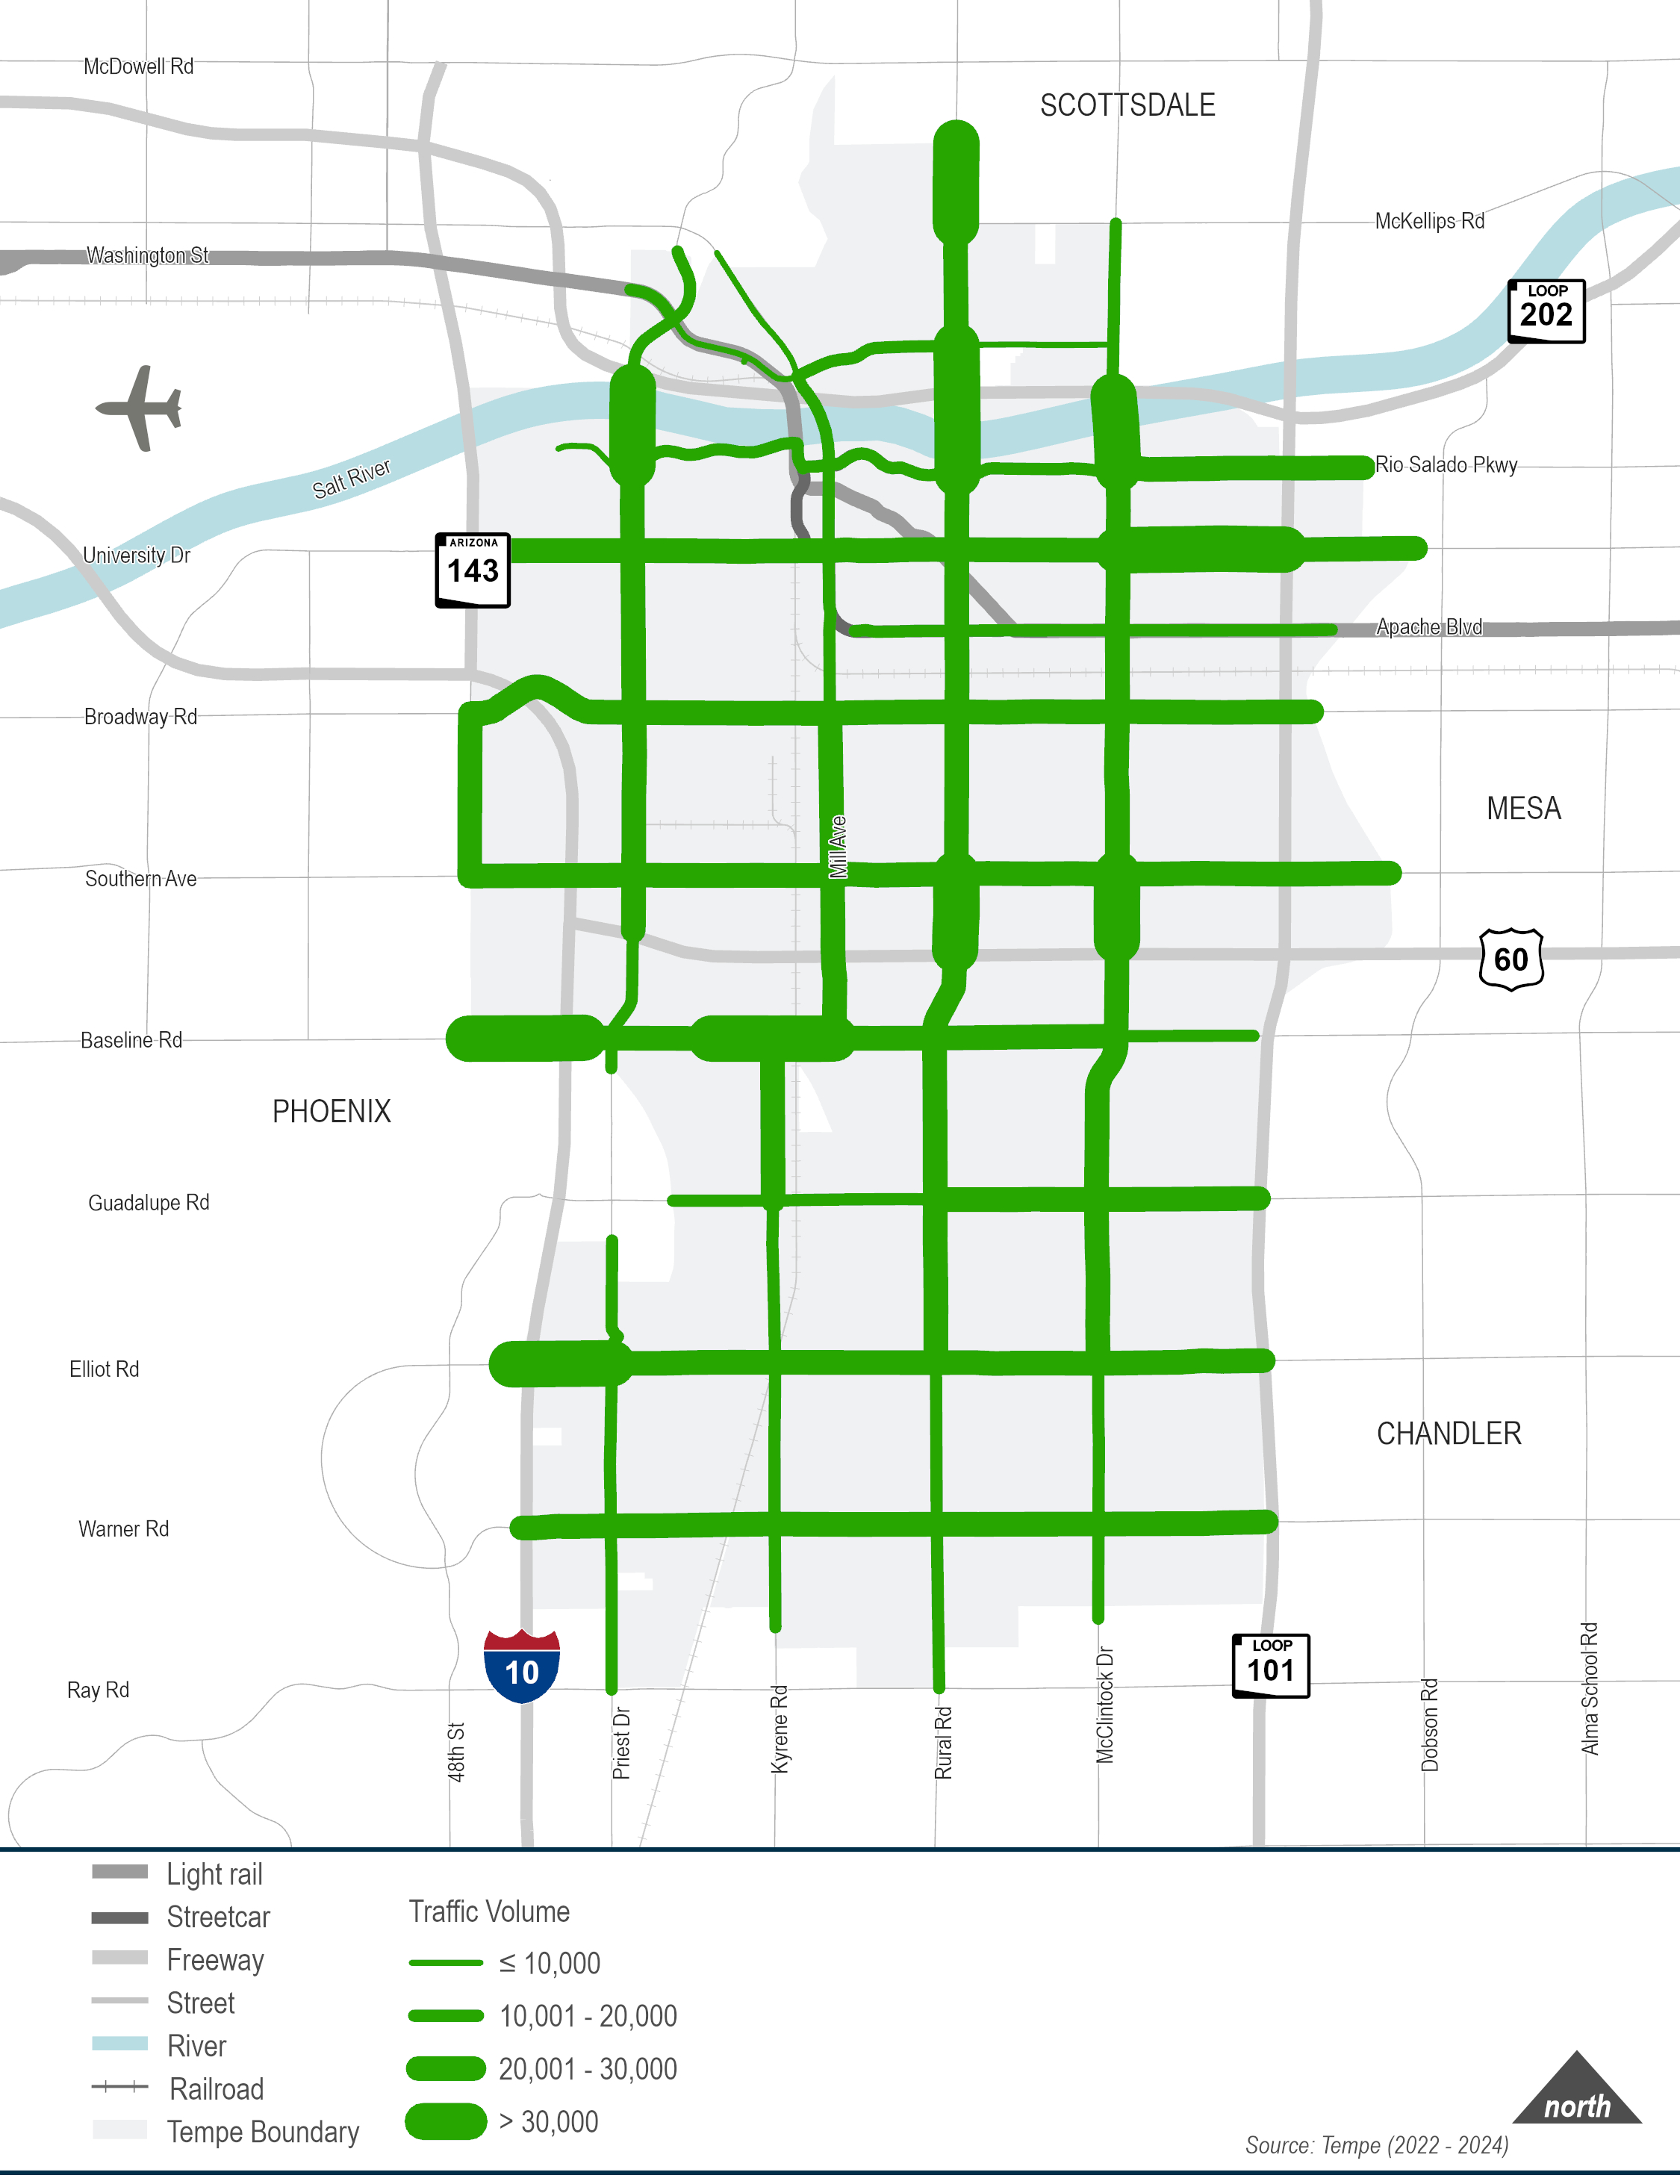
Congestion is caused by volumes at the peak hours, or non-recurring incidents such as a crash. Even with traffic volumes returning to pre-pandemic levels, differences in the distribution of travel may lead to changes in congestion levels. Traffic flow is highly nonlinear and a small reduction in peak demand on a congested roadway can cause outsized reductions in traffic congestion.
This video clip shows the average mid-week traffic congestion over a 24-hour period representing the high season (September through May). Data represents real time travel speeds of millions of individual vehicles over this period. The Travel Time Index (TTI) is the ratio of the travel time during the peak period to the time required to make the same trip at free-flow speeds; a higher TTI represents higher congestion.
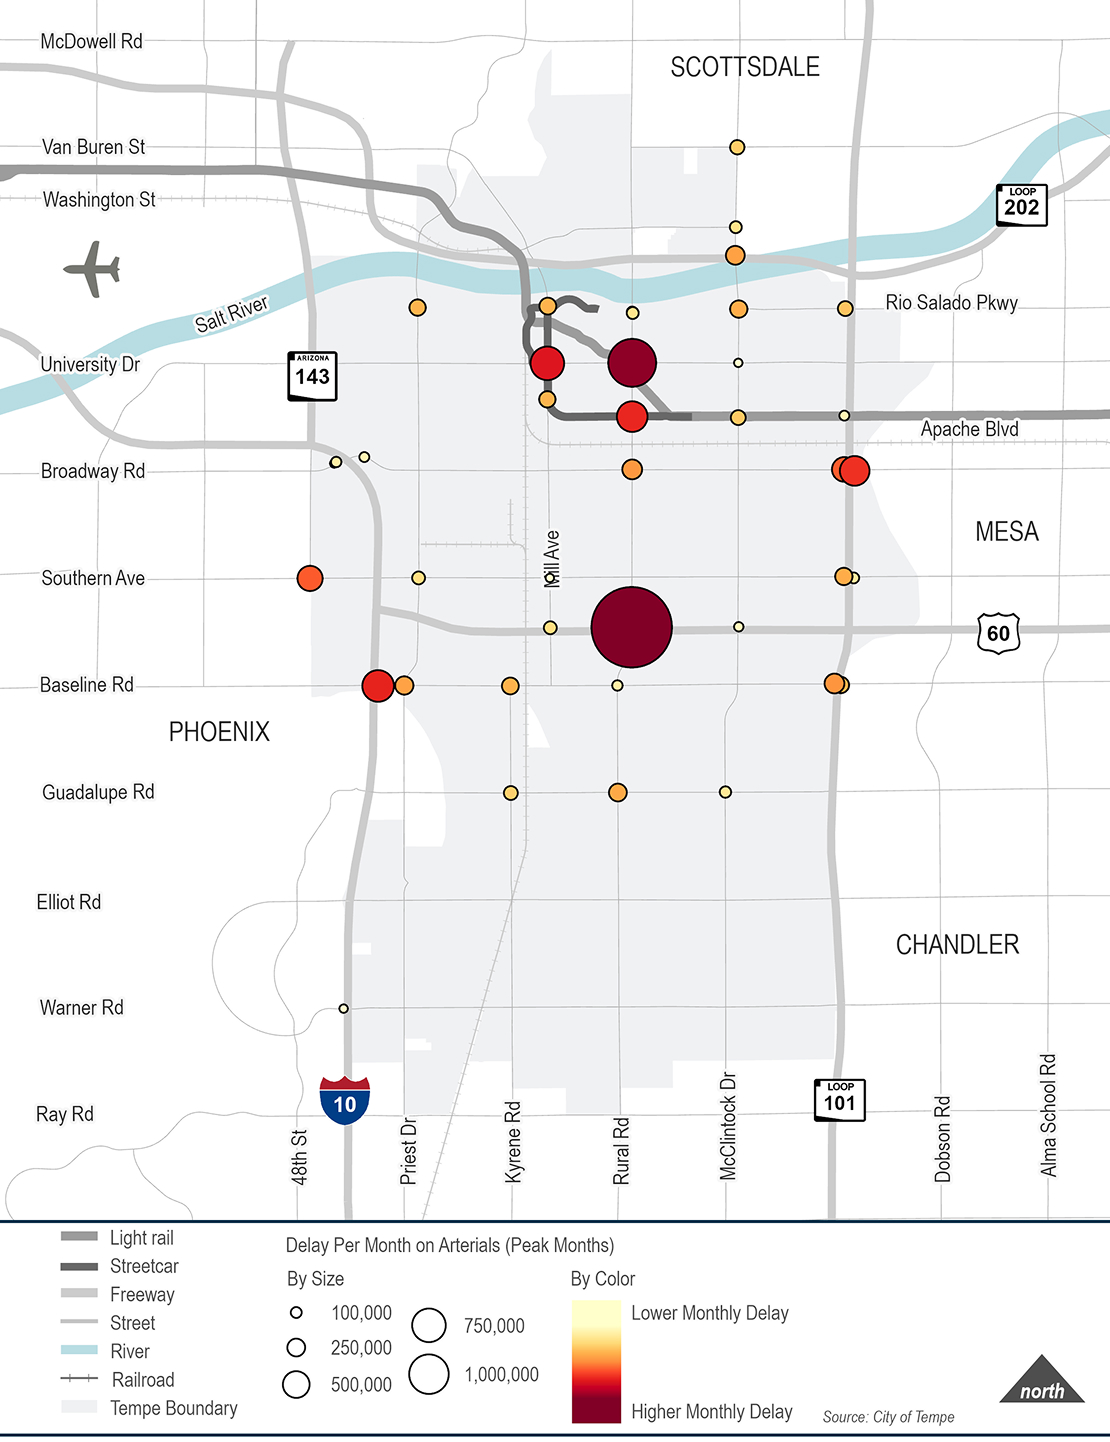
Bottlenecks are areas on a road where traffic slows down considerably, creating congestion and delays. INRIX Data was evaluated to identify the greatest bottleneck locations in Tempe.
Figure shows the bottleneck locations during the high season of September 2024 through May 2025.
Safety
Fatal and Serious Injury Crashes Over Time
From year to year, the number of crashes at a site will randomly fluctuate up and down. Over time, however, this random fluctuation will balance out to what can be considered the long-term expected average number of crashes at the site. The Plan analyzed crash data from July 1, 2019 through June 30, 2024.
- FY 2024 witnessed a meaningful decrease in motor vehicle only FSI crashes (-25%)
- FY 2024 saw a substantial increase in pedestrian involved FSI crashes (+31%)
- Annual motorcycle FSI crashes equaled motor vehicle only FSI crashes in FY 2024
- FSI crashes fell at the beginning of the pandemic before rising sharply beginning in 2022
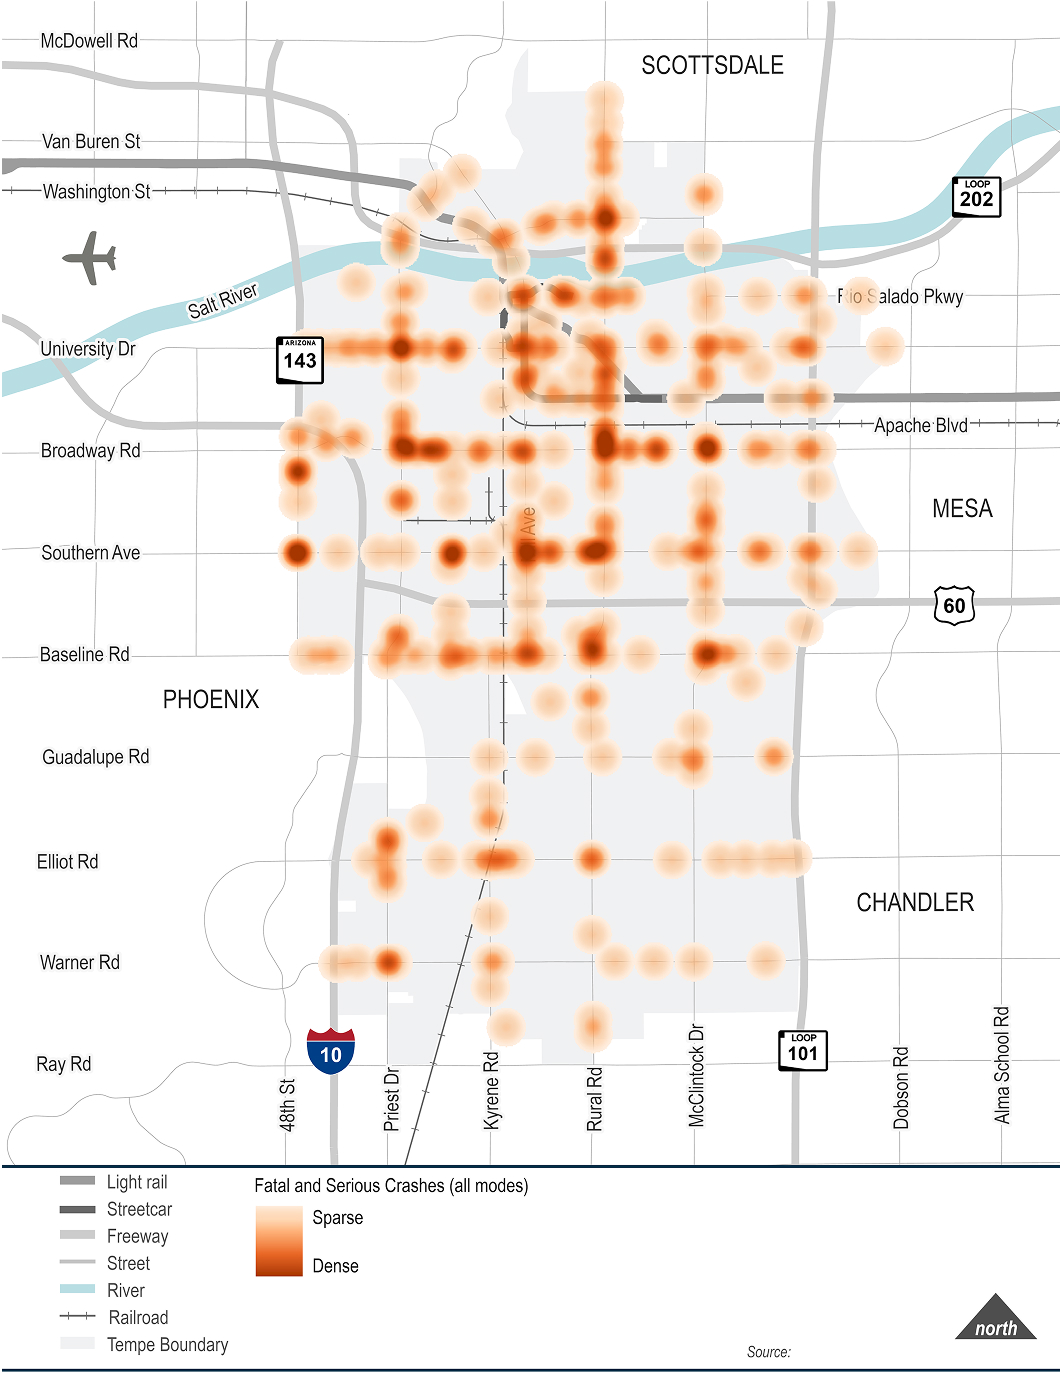
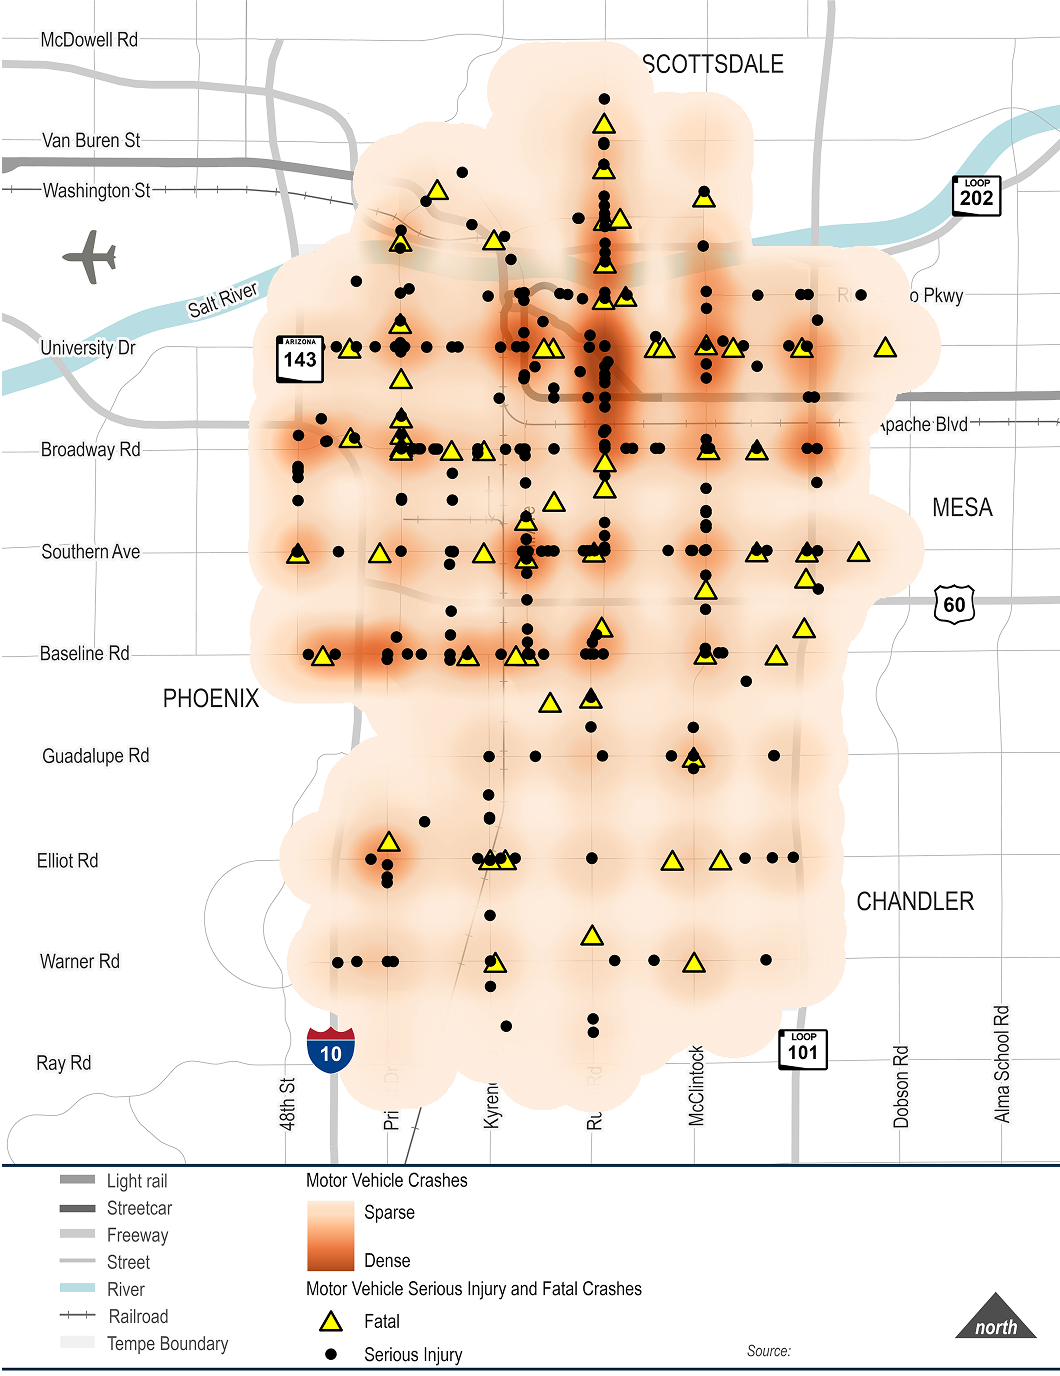
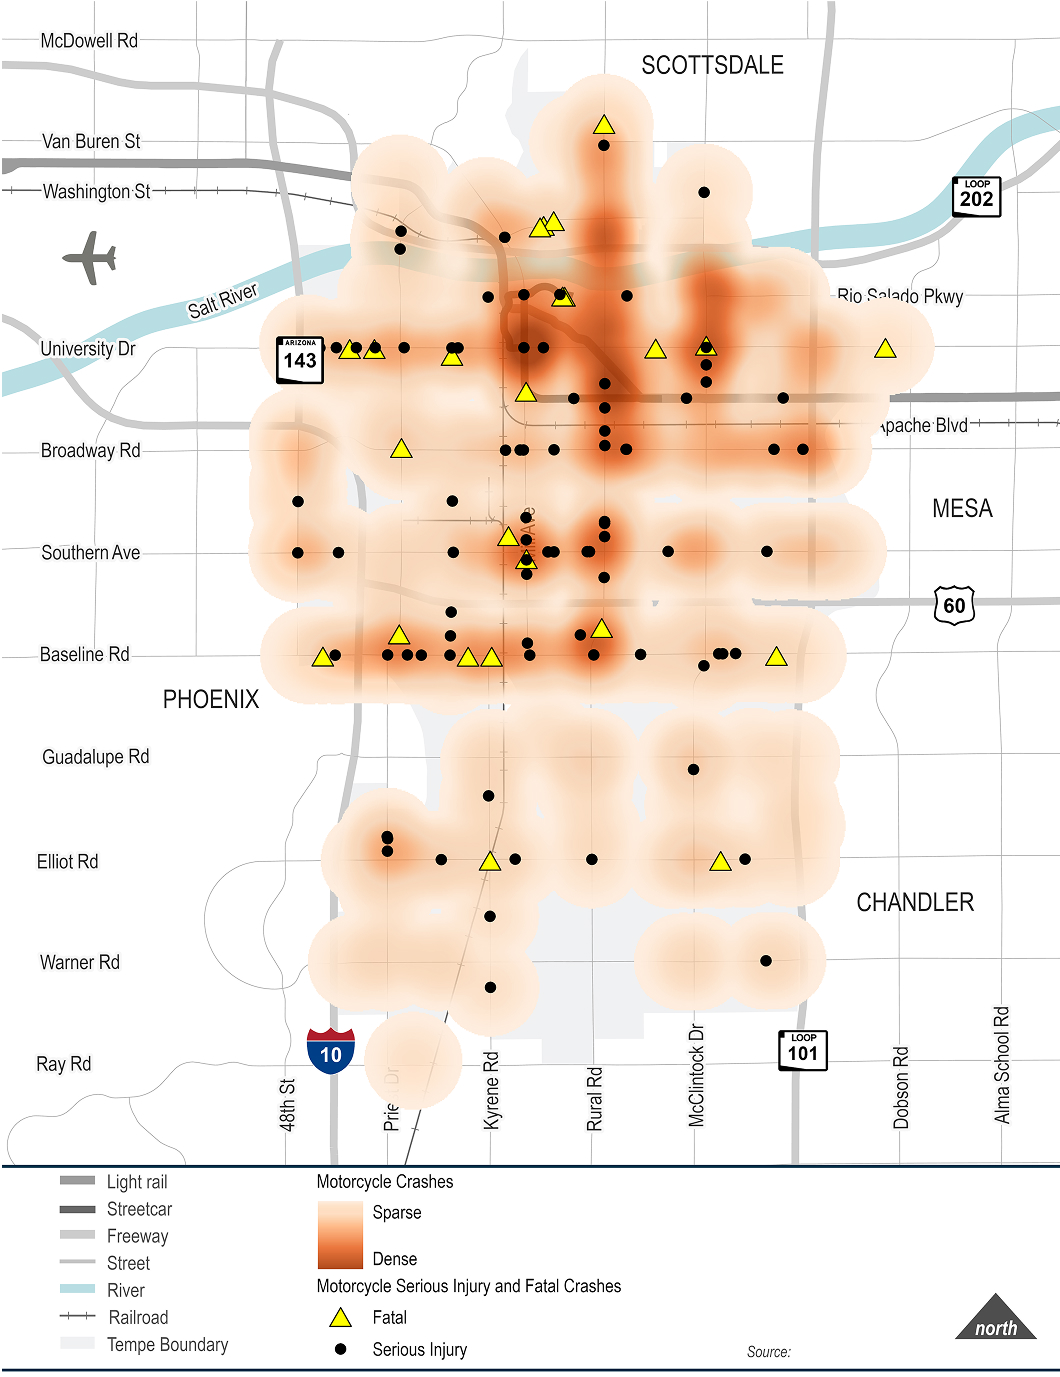
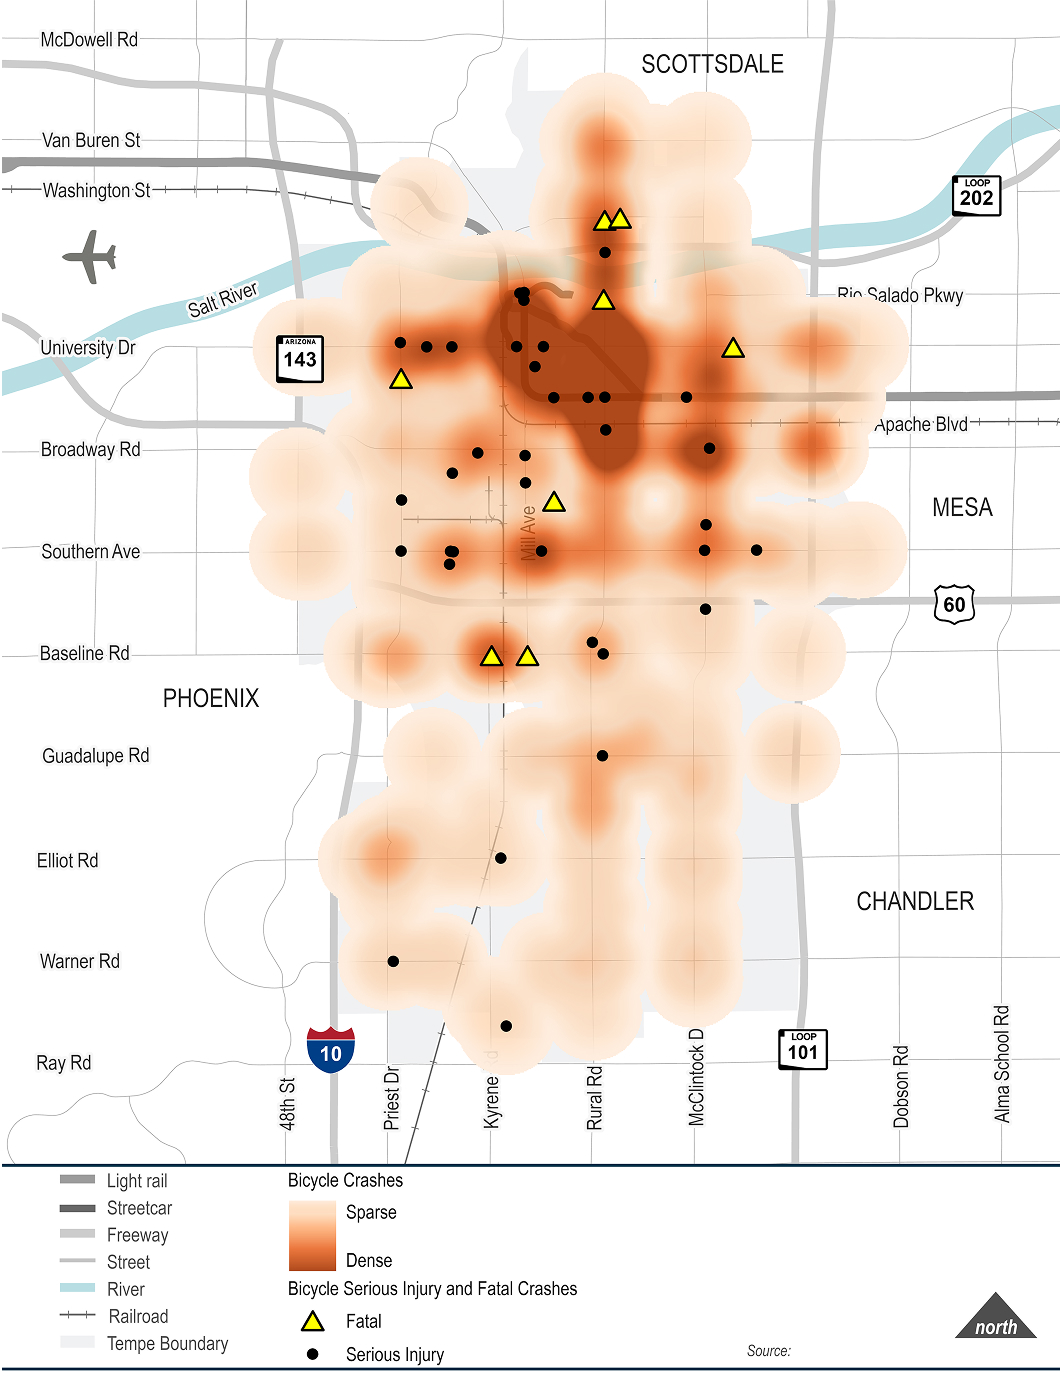
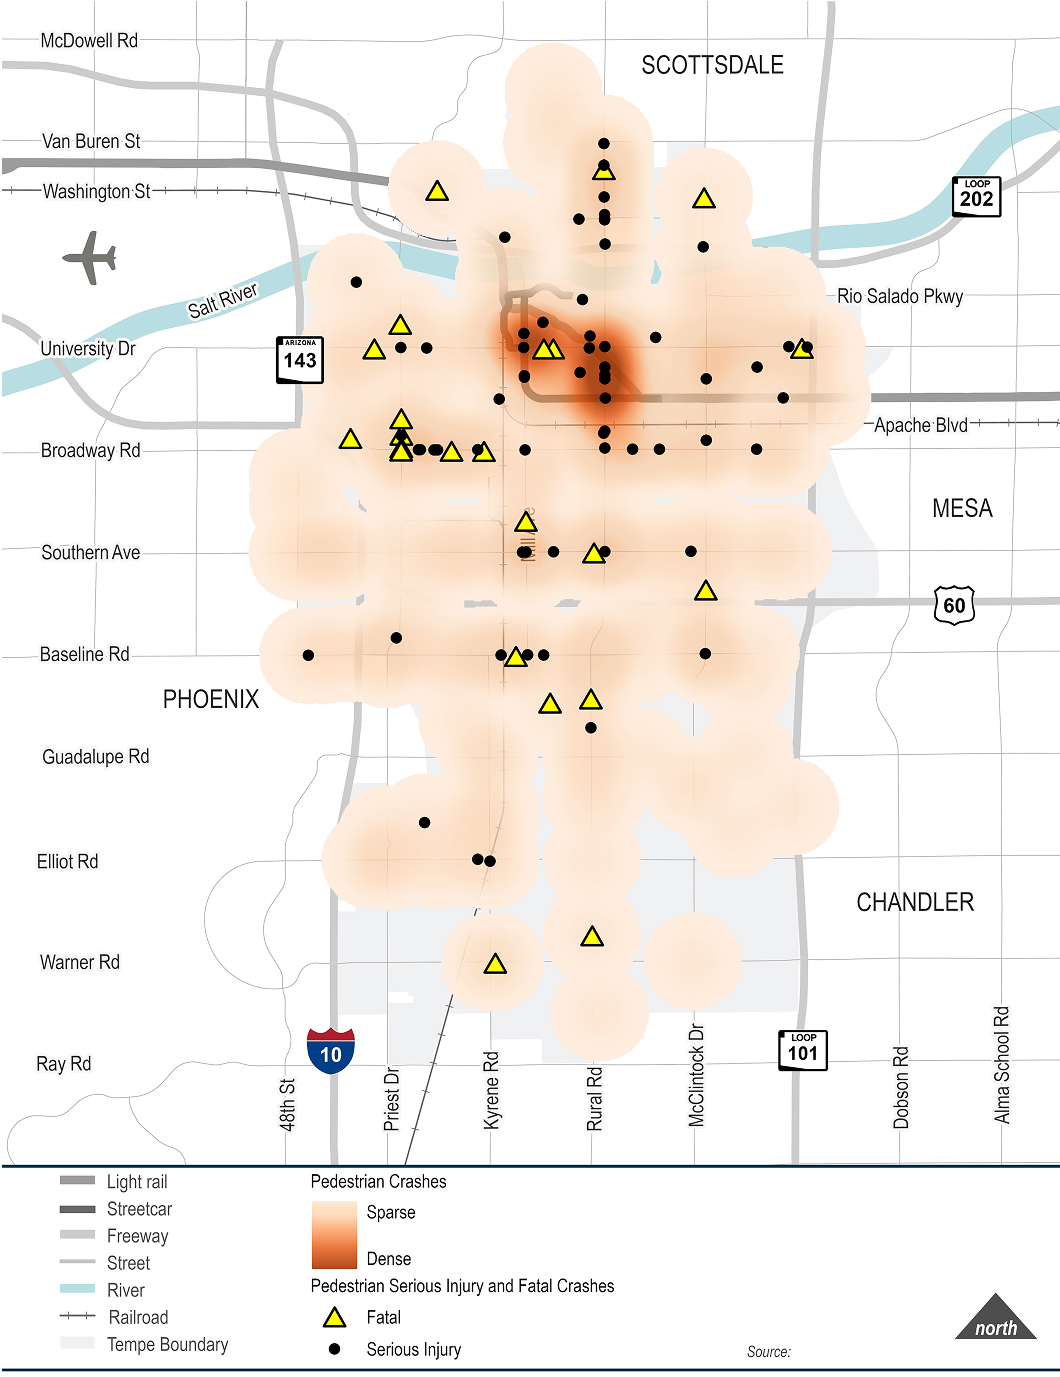
Crash Heatmaps
A crash heatmap is a visualization tool used to analyze and understand road accidents. It presents crash data using color gradients to represent the frequency or intensity of accidents across a geographical area.
Active Transportation
Active transportation networks—including bike lanes, sidewalks, and multi-use paths—provide safe, comfortable, convenient, reliable, efficient, and affordable ways for people to get around Tempe.
Pedestrian Facilities
The City of Tempe’s pedestrian network, which is comprised of sidewalks, walkways and multi-use paths, has been developed to encourage walking as a viable mode of transportation and includes ADA-accessible amenities.
Sidewalks are present along approximately 90% of Tempe’s street network.
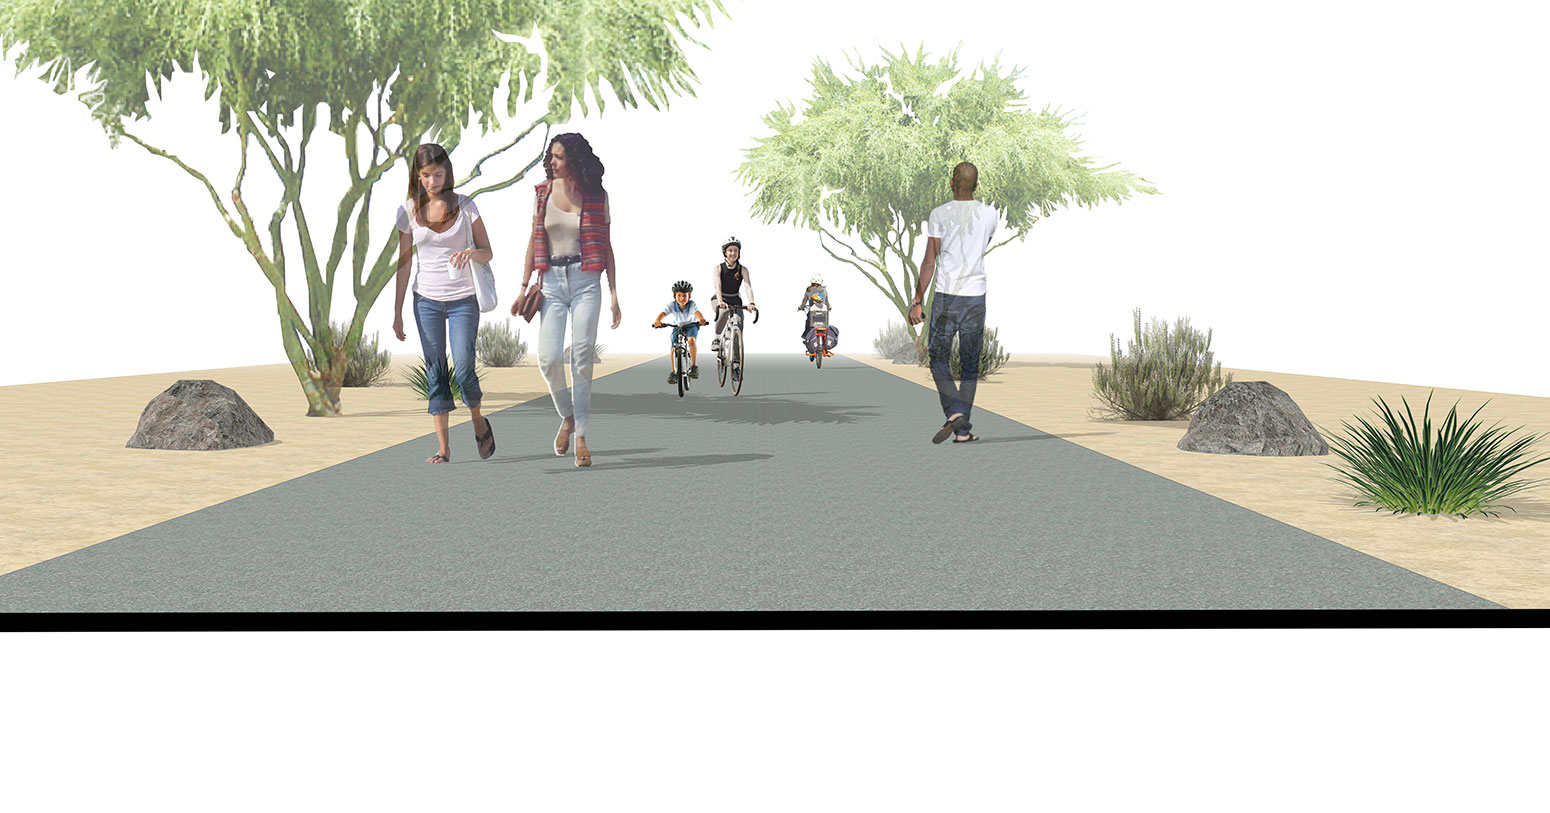
Multi-use Paths
The pedestrian and bike networks are complemented by multi-use paths that accommodate all active transportation modes in a shared environment.
Multi-use Paths are paved paths completely separate from the roadway and automobile traffic designated solely for bicycles, mobility devices, shared active transportation vehicles, horses, skateboards, and pedestrians. Multi-Use Paths are a minimum of 10 feet wide.
Shared Active Transportation
Scooters operated in Tempe by vendors require right-of-way use licenses, indemnification and insurance.
- Riders logged 864,464 miles from June 2024 - June 2025, a 4 percent increase over the prior year
- Average distance traveled 1.61 miles
- Average duration 16.5 minutes
Shared Active Transportation Vehicle Use in Tempe
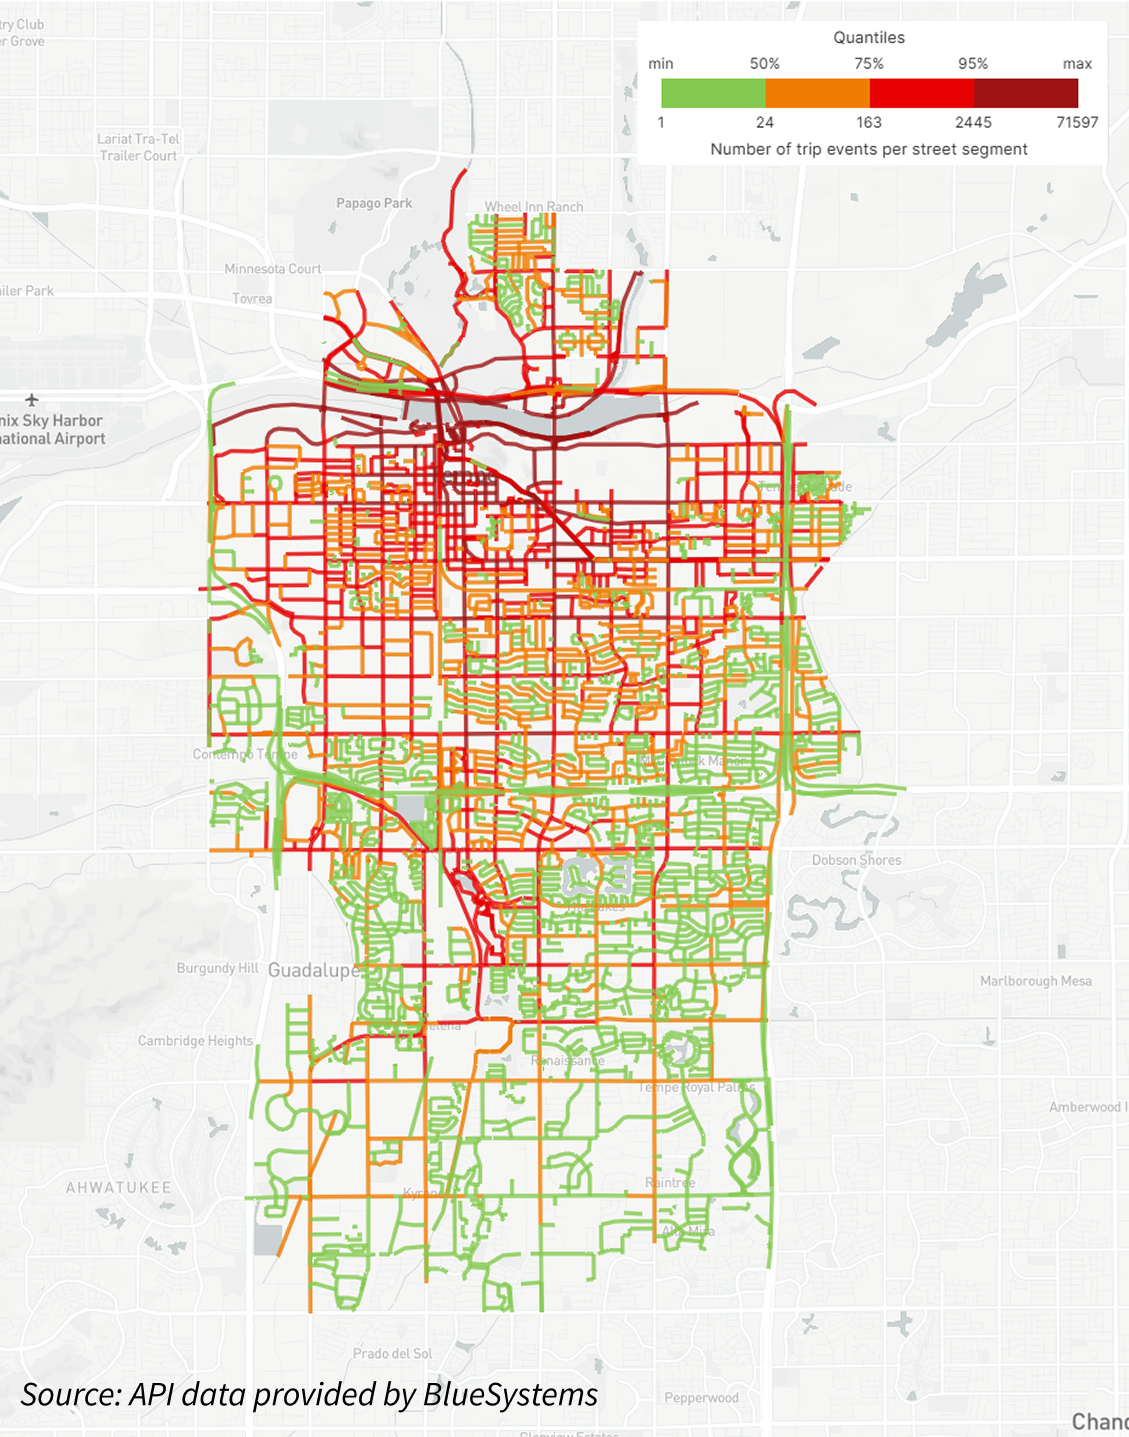
The map depicts the density of SATV usage throughout Tempe for a full year (ending June 2025).
Bicycle Network
Bicycling is an important mode of travel throughout Tempe. In 2023, the League of American Bicyclists re-designated Tempe a Gold-Level Bicycle Friendly Community, demonstrating Tempe’s commitment to promoting cycling through significant investments in infrastructure, education, encouragement programs, and policy changes.
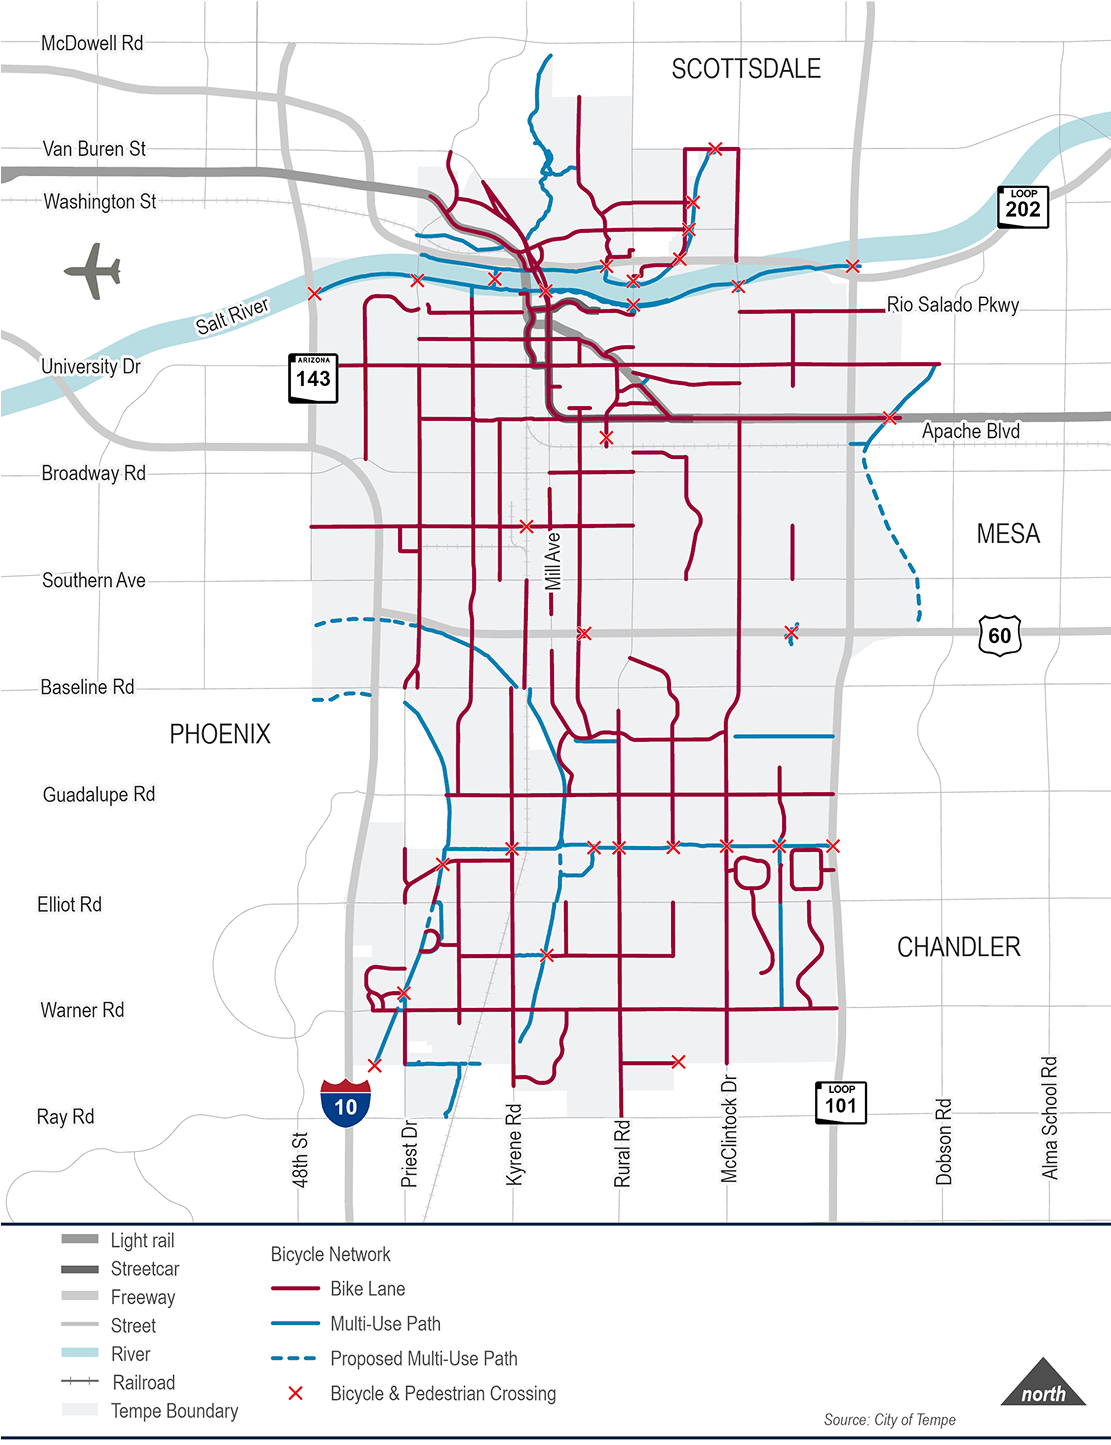
Existing Bikeway Network
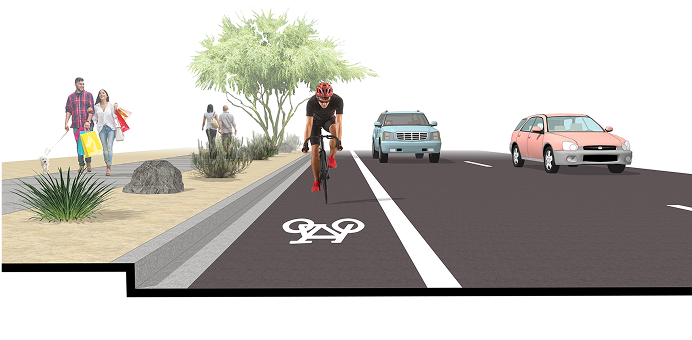
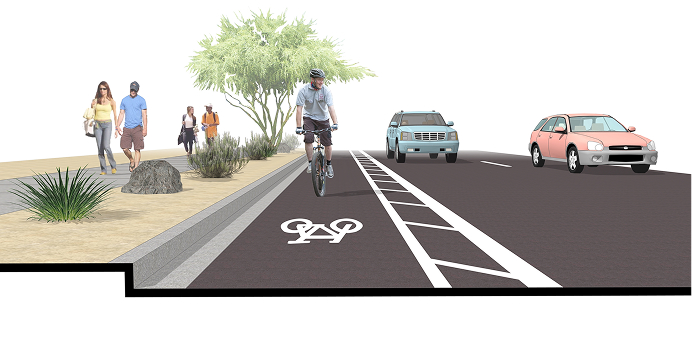
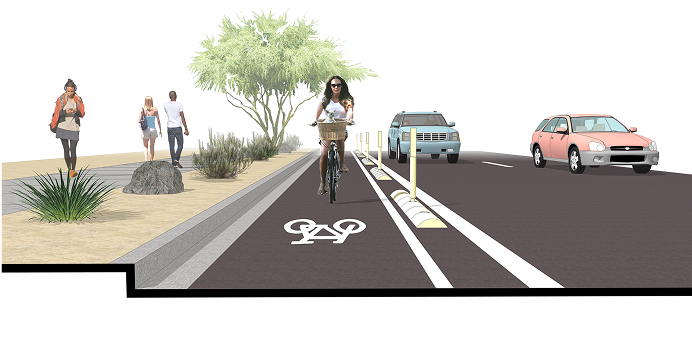
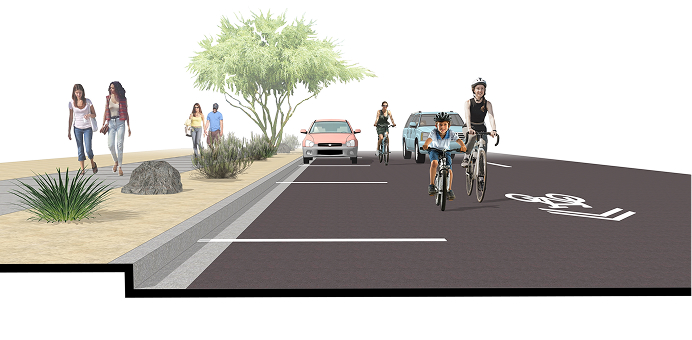
The existing network of bike facilities consists of a blend of dedicated on-street facilities, shared on-road facilities, and dedicated multi-use separated facilities.
Examples of On-street Bicycle Facilities
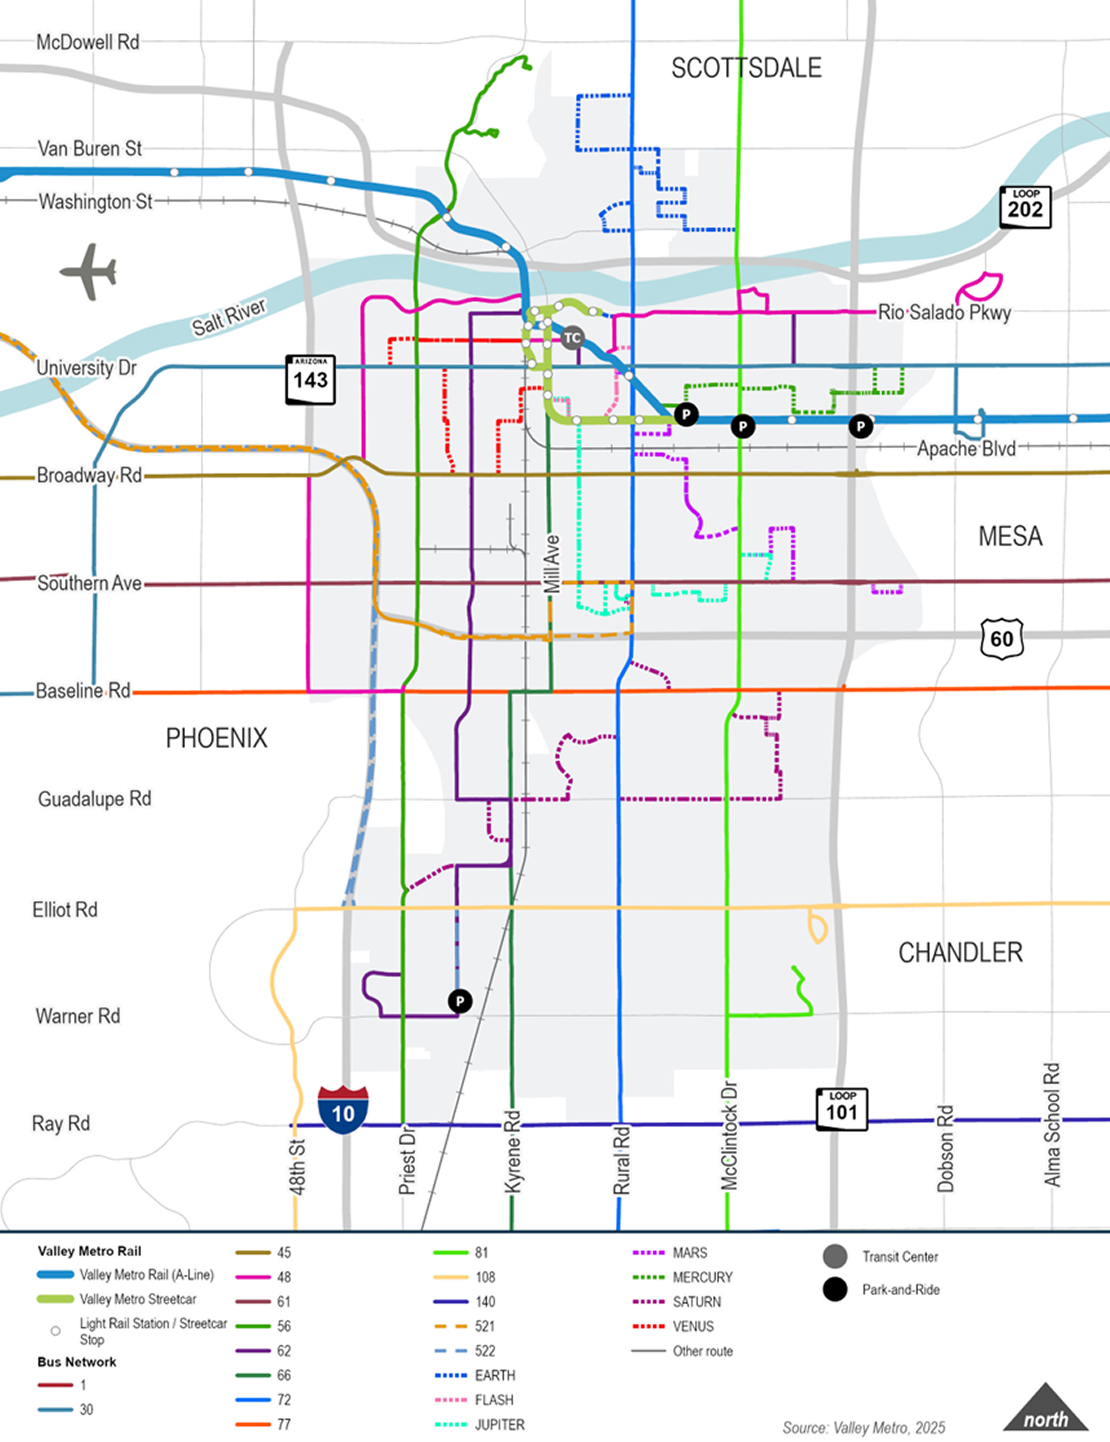
Transit Network
A goal of the Tempe General Plan 2050 is to coordinate and produce efficient, safe, convenient and interconnected transit options to increase ridership. A key objective of this is to enable residents to comfortably and safely walk, bike, or take transit within a 20-minute distance to access any daily necessities and amenities, local employment centers, and commercial and mixed-use developments.
Did you know?
Tempe’s Transit Fleet is fueled 100% by alternative fuels!
Tempe Transit Annual Ridership Fast Facts:
- 7,089,678 total boardings
- 4,403,727 total revenue miles
- 1.61 boardings per revenue mile (highest in the region)
- 18.4% share of total regional boardings
- 12.5% share of total regional miles
Rail
- Light Rail
- Streetcar
Bus
- Local bus
- Neighborhood circulator
- (Orbit & ASU FLASH)
Express bus
ADA Paratransit
- RideChoice
Facilities
- Transit center
- Park-and-Rides
- Bus stops
- East Valley Bus Operations & Maintenance Facility (LEED certified)
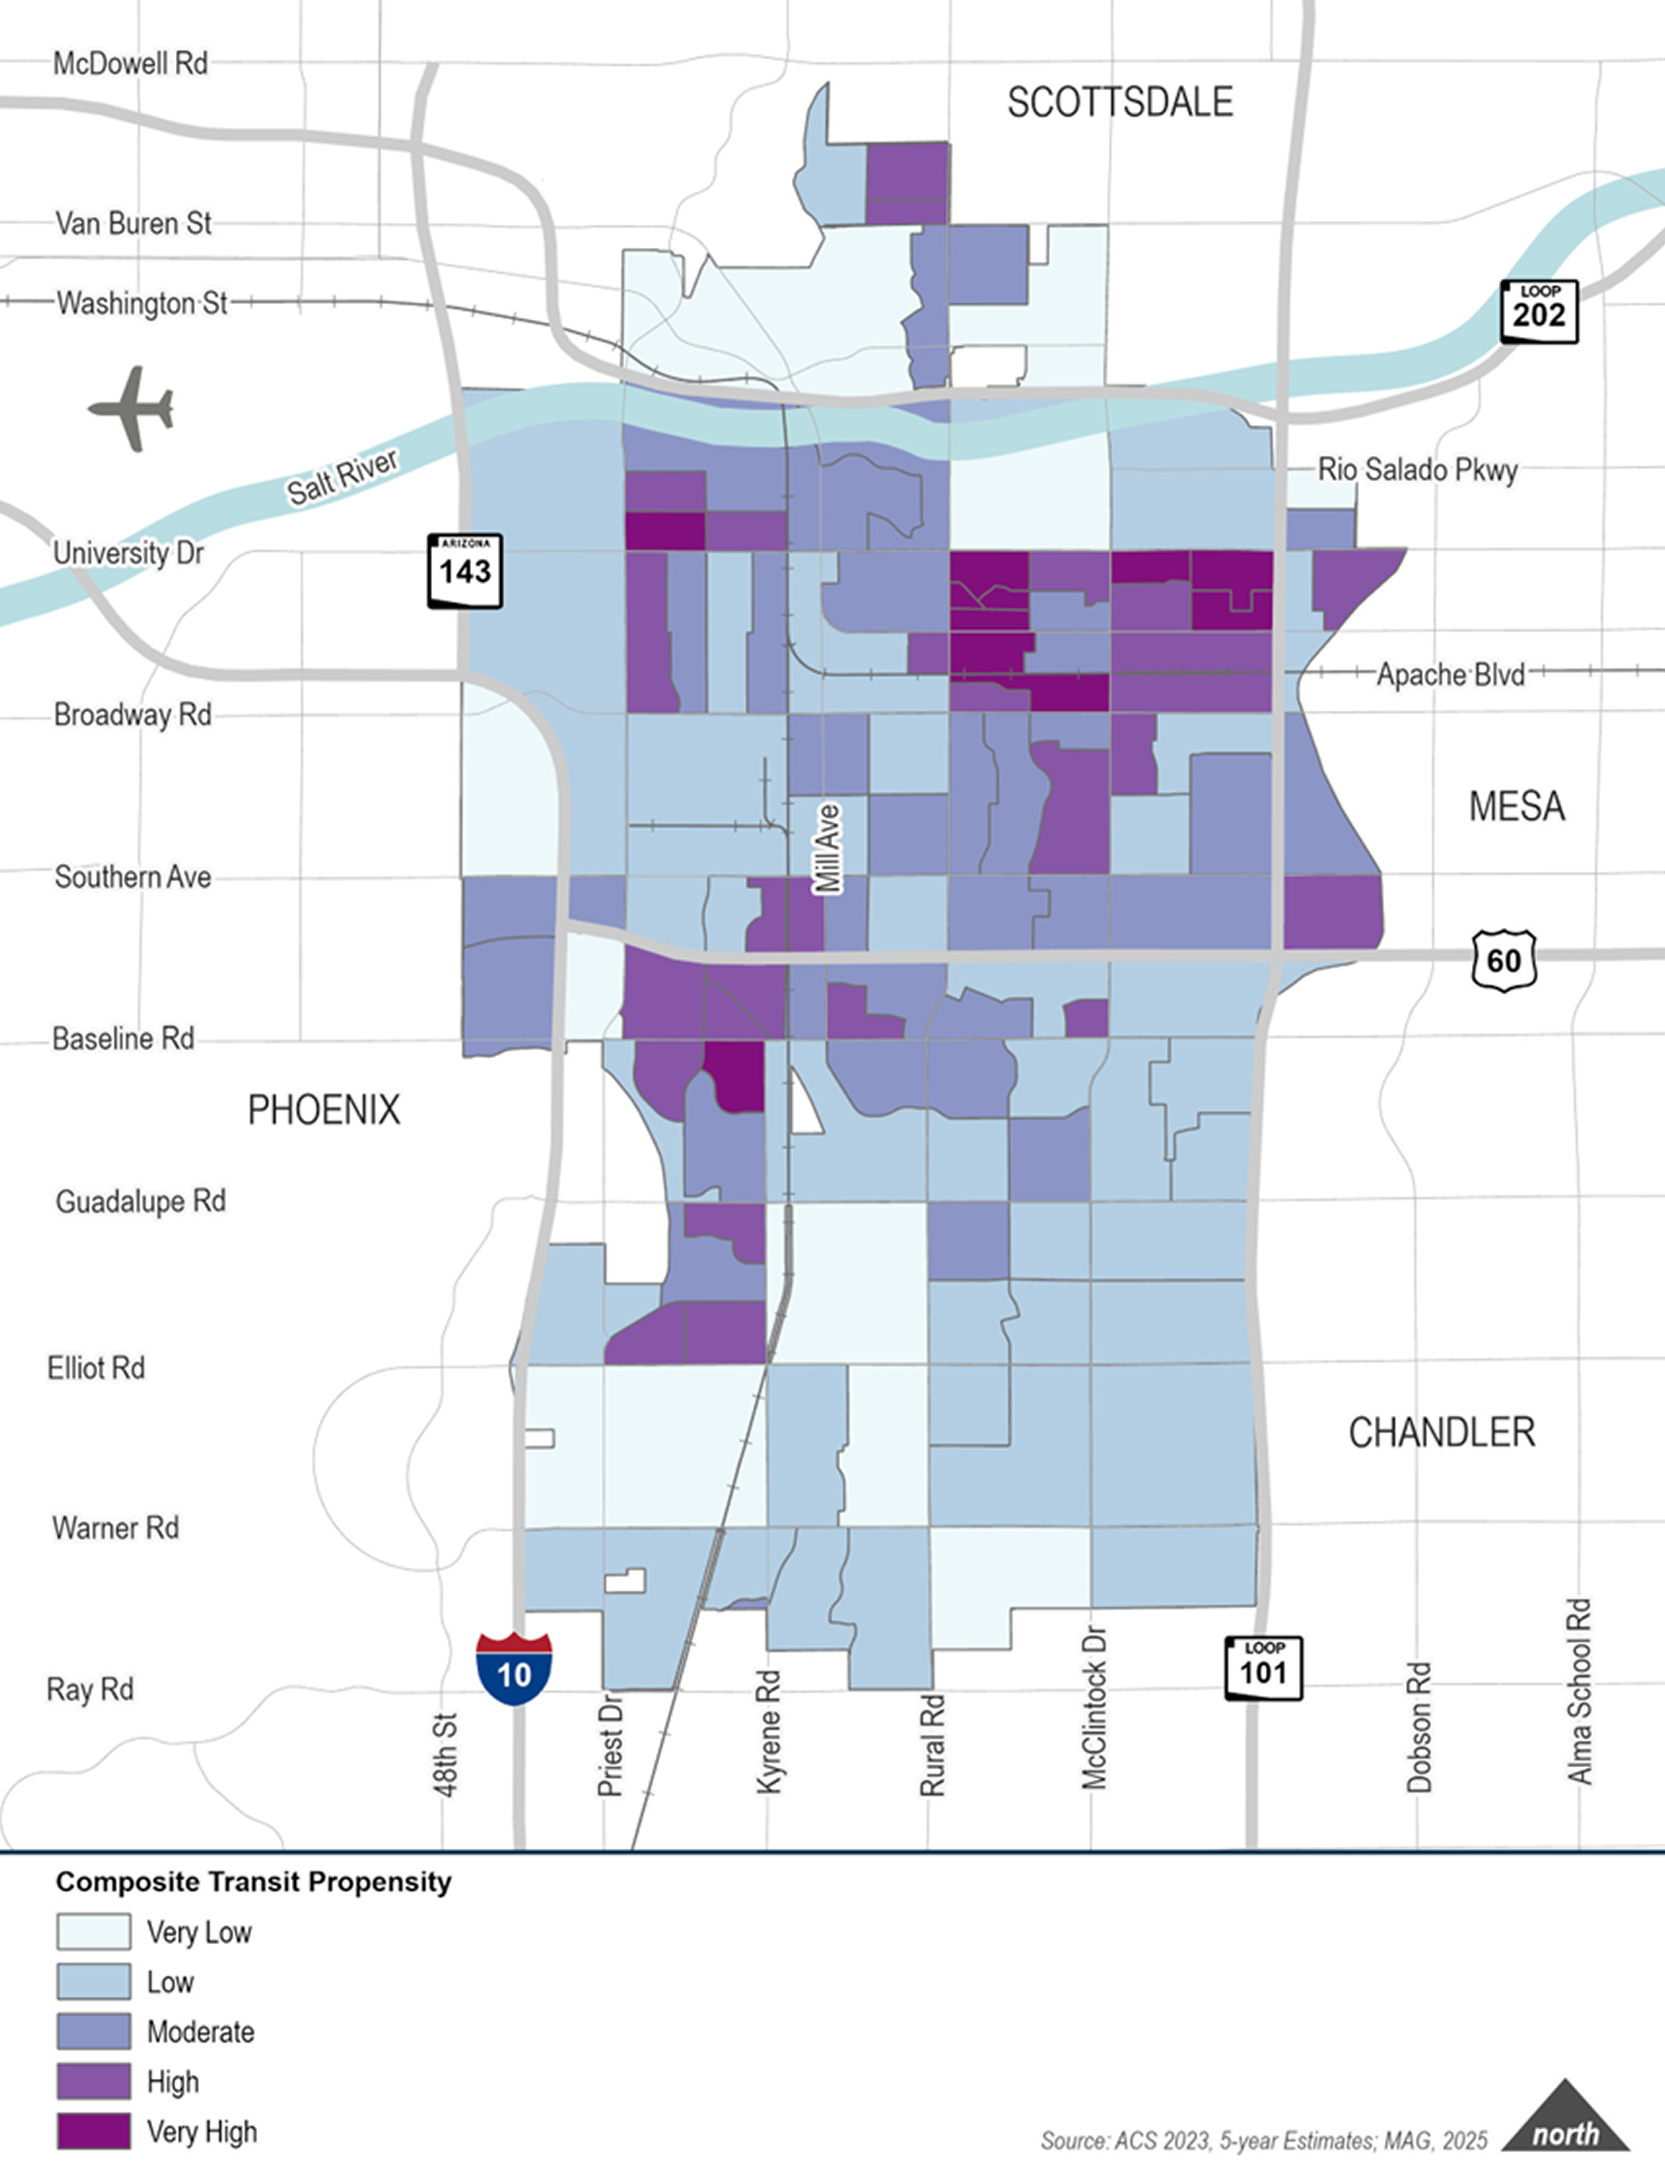
Transit propensity is the overall likelihood of public transport use in a particular area. It combines several demographic variables known to contribute to transit dependency, and indicate where potential transit demand is highest. These variables include:
- Population
- Employment
- Minority Population
- Low-income Population
- Youth and Senior Population
- Disabled Population
- Zero Auto Households
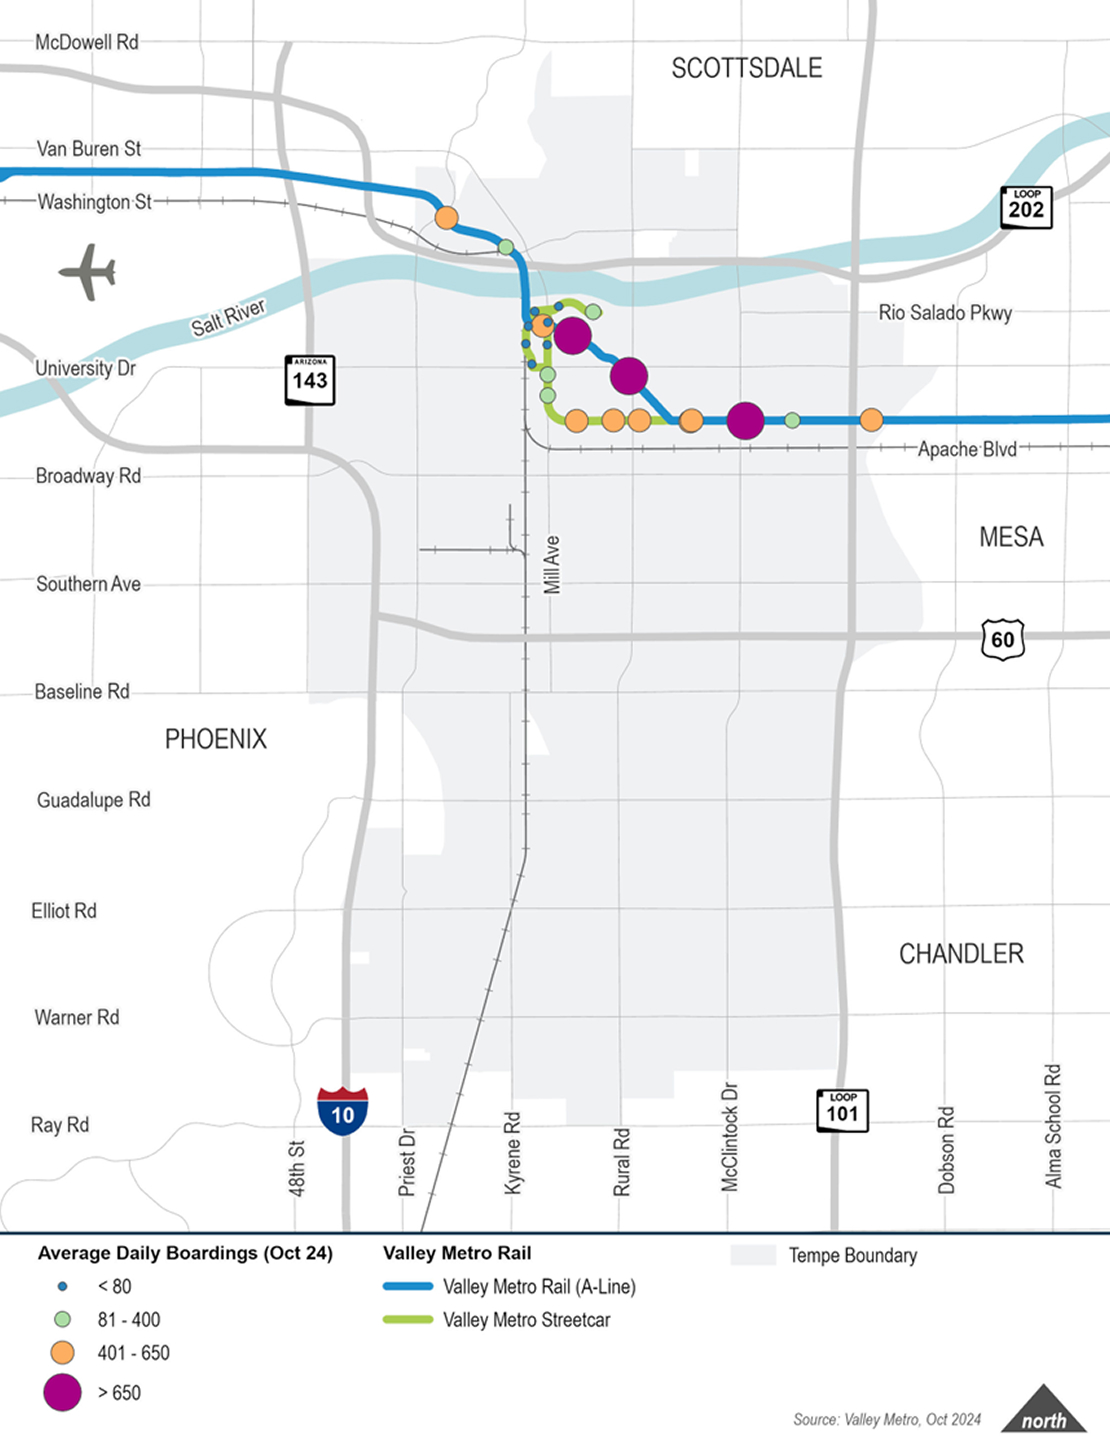
Three light rail stations are top ten system-wide:
- University Dr / Rural Rd: 1,532 boardings (#3)
- McClintock Dr / Apache Blvd: 1,106 boardings (#6)
- Veterans Way / College Ave: 1,093 boardings (#7)
Top streetcar stops:
- Dorsey Ln / Apache: 622 boardings
- Rural Rd / Apache: 578 boardings
- College Ave / Apache: 493 boardings
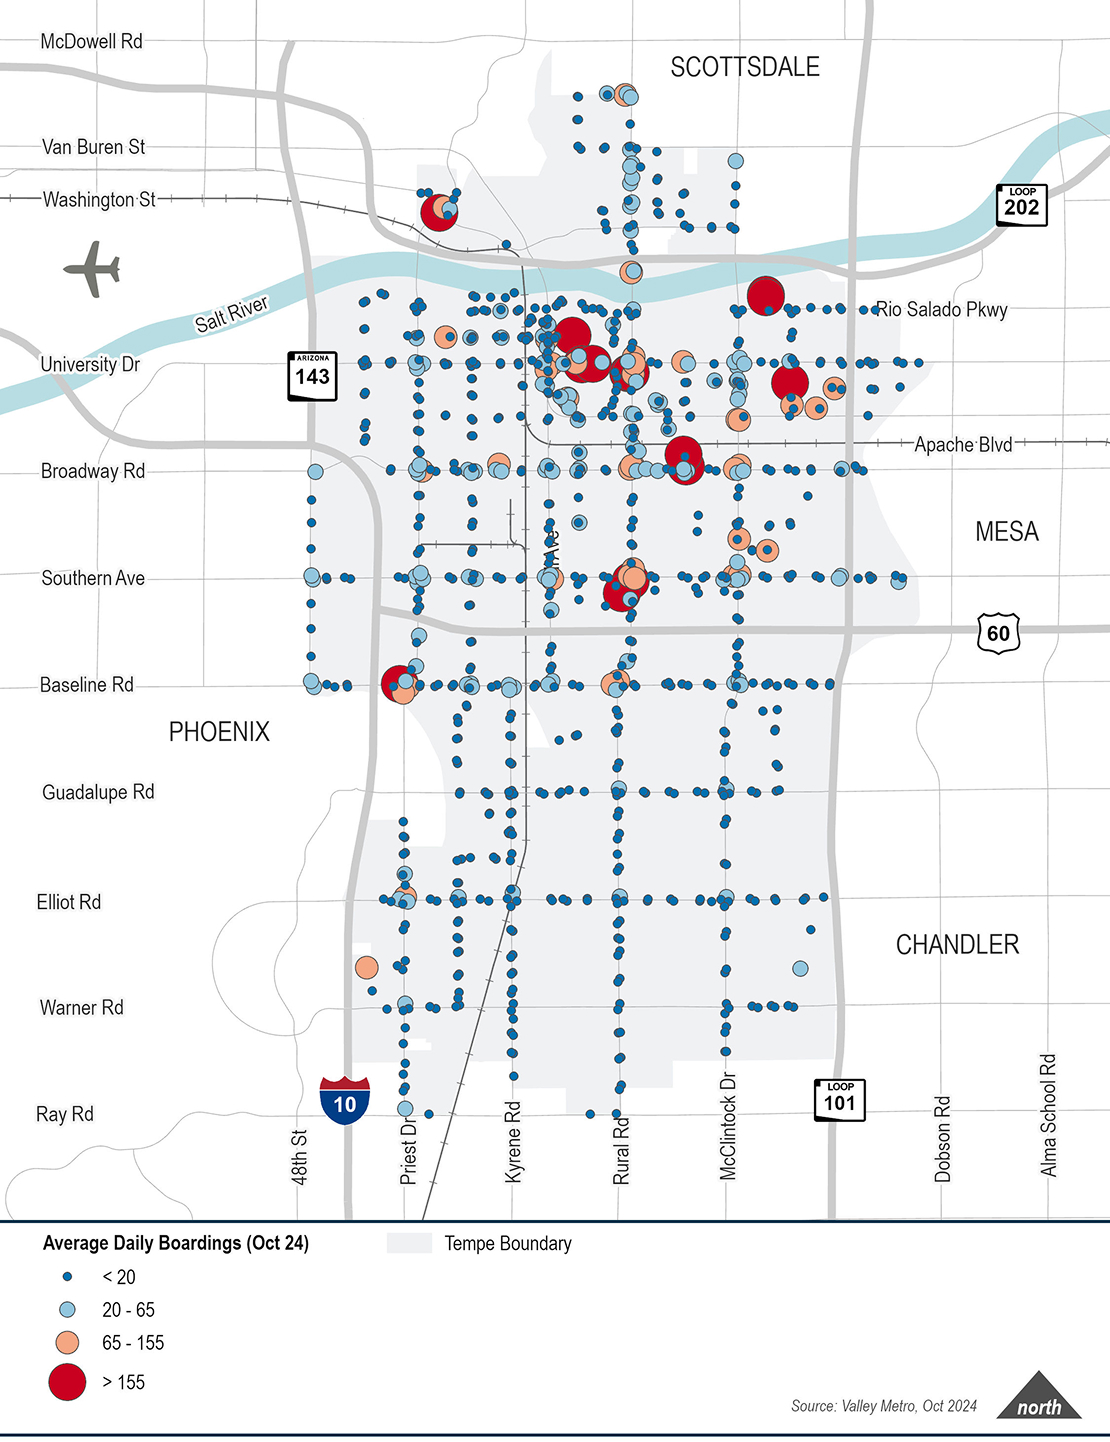
Highest ridership stops:
- Tempe Transportation Center: 1,700 boardings
- University Dr and College Ave (EB): 562 boardings
- University Dr and Palo Verde Dorms (EB): 289 boardings
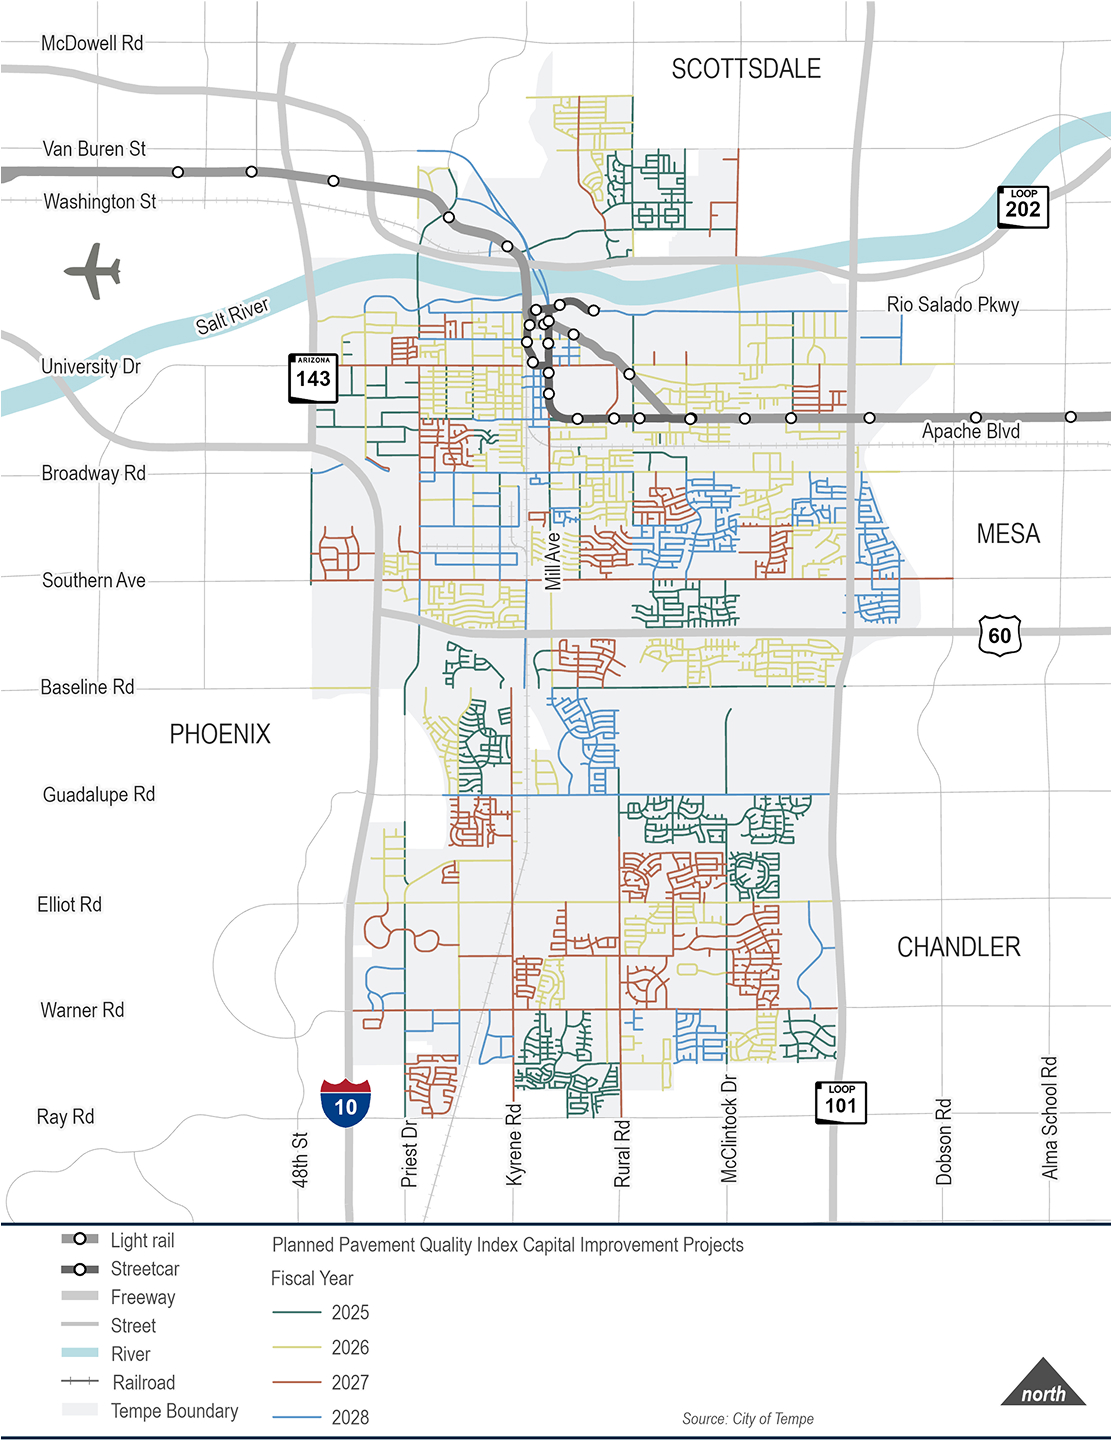
Street Improvement and Pavement Bond
In 2024, Tempe voters approved a bond measure to accelerate Tempe street improvements. Work has begun to improve streets citywide and will continue through 2028, with a focus on enhancing pavement quality and overall street safety. In some cases, street paving will be done in tandem with a larger streetscape project* that aligns with Tempe’s sustainability goals. Improvements may include:
- Multimodal Transportation
- Street Signage
- Bike Lanes
- Sidewalk Improvements
- Greater ADA Accessibility


More information may be found at Tempe’s Pavement Management Program.
Shape the Future of Tempe
Your input on the following survey is important as it will help guide our teams to make decisions that will enhance quality of life through equitable, safe and connected transportation.
Share Location-specific Comments
Tempe would like to hear from you! What concerns or ideas do you have for transportation in Tempe? Use the pins to identify a location or area of concern to share your thoughts.
Drop a pin based on one of the categories of comments, or add your thoughts in the comment form below. Staff will review and consider your comment as we plan for Tempe's future.
Documents & Helpful Links
- Tempe Tomorrow: General Plan 2050 (Adopted 2023)
- Tempe Transportation Master Plan (2015)
- Vision Zero Action Plan (2019)
- Transportation Alternatives Program (2025)
- Rain to Roots Master Plan (Ongoing 2025-)
- ADA Transition Plan (2018)
- Tempe Transportation Overlay District
- Tempe Climate Action Plan (2019 & 2021 Update)
- Parks & Recreation Master Plan (2021)
- Making Space: An Equity Study for Tempe Parks and Recreation (2023)
- Character Area Planning
- Innovation Hubs
- Preserves Management Plan (2025)
- Adaptive Streets Implementation Design Guide (2022)
- Downtown Curb Management Study
- Tempe Capital Improvement Program (2025)
- MAG Regional Bus Rapid Transit Feasibility Study Final Report (2021)
- MAG Regional Transportation Plan: Momentum 2050
- MAG Active Transportation Plan (2020)