
Gaps & Needs
The Gaps and Needs assessment lays the foundation for understanding how the transportation system meets community, economic, and mobility goals.
Identifying Needs
We identified the needs for the transportation system based on Tempe’s vision and goals and community input. We received over 400 responses to our community survey.
What we Heard
- Among the reasons to walk/roll more, 67% of respondents desired more shade and 33% of respondents desired vehicle/pedestrian separation.
- The two most-selected safety treatments include signalized active transportation crossings and signal timing.
- 63% of respondents use transit; while the remaining 37% do not.
Understanding Gaps
We applied a fact-based understanding of system deficiencies (“gaps”) and consideration of community identified gaps.
By identifying deficiencies, unmet demand, safety concerns, and opportunities the Gaps and Needs analysis provides a clear picture of the transportation system’s most pressing challenges.
Explore by Topic
Explore the gaps and needs in service and/or safety across the following modes of transportation:
Safety
Tempe’s Safety Gaps and Needs analysis examines where and why serious crashes continue to occur and what is needed to create safer streets for everyone. The analysis focuses on three key areas: the High-Injury Network, safety gaps affecting vulnerable road users, and broader systemic safety issues. This work builds on the City’s 2019 Vision Zero Action Plan, recognizing that strong policies, coordinated processes, and proven strategies are essential to eliminating traffic-related serious injuries and fatalities. Many of the 2019 Action Plan strategies are completed or underway. This update provides an opportunity to strengthen Tempe’s safety approach.
How We Identified Gaps & Needs
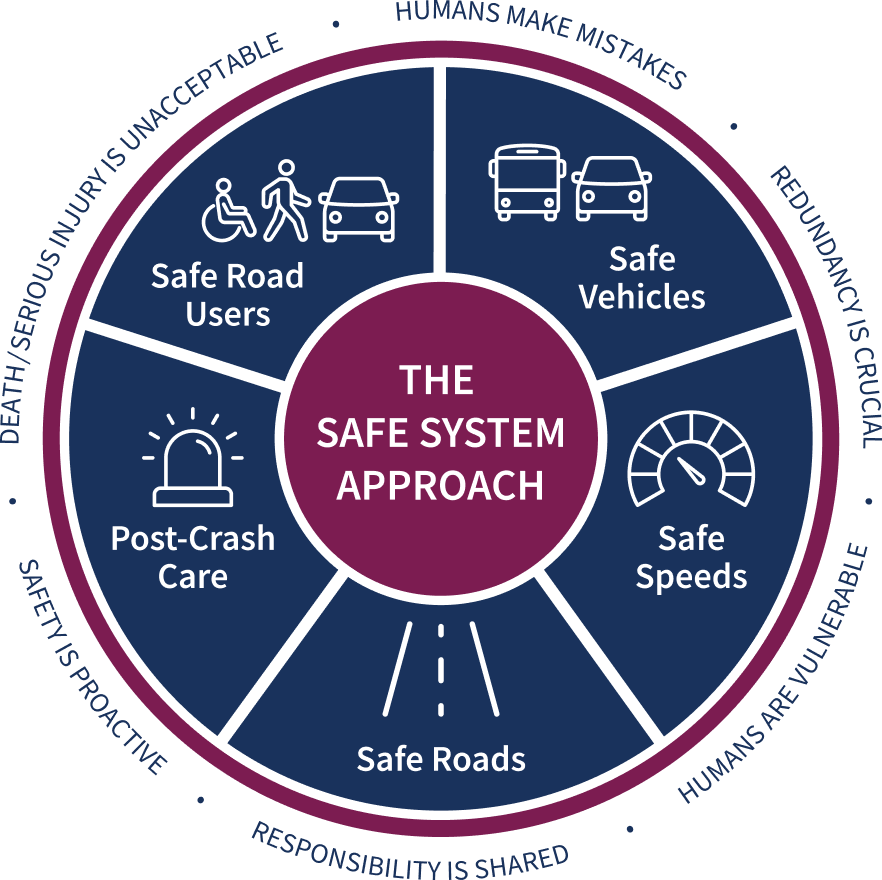
To identify gaps and prioritize next steps, existing safety strategies were evaluated using the Safe System Approach (see graphic). Strategies were categorized across the five Safe System elements, compared against national best practices, and assessed to determine which best practices are already in place and which have yet to be implemented. This process helps clarify where Tempe is making progress and where additional focus and investment are needed to advance safer streets citywide.
High Injury Network
A High Injury Network (HIN) is a map of corridors that identifies a network of streets and intersections with higher rates of fatal and serious injury crashes (FSI). Between July 2019 - June 2024 there were 392 FSI crashes.
Based on the location of FSI crashes, the city developed a segment-based HIN and an intersection-based HIN. These networks are an important tool that can help the City focus limited resources in problematic areas - specifically the HINpriority corridors, as shown on the map.
Segment High Injury Network
- 53% of FSI crashes took place at segment locations between 2019-2024.
- HIN segments account for only 14% of major road miles, but nearly ½ (48%) of FSI crashes.
- Segment FSI crashes by type:
- Angle
- Rear End
- Left Turn
- Single Vehicle
- Head On
Intersection High Injury Network
- 47% of FSI crashes took place at intersections between 2019-2024.
- 50% of the HIN intersections are located along a HIN segment.
- Intersection FSI crashes by type:
- Left Turn
- Angle
- Rear End
Explore the High Injury Network Map
Use this interactive map to explore streets and intersections in the city where serious and fatal crashes are most concentrated, known as the High Injury Network. Pan and zoom to navigate, click highlighted streets to view details. Use the Layers and Legend panels to turn data on or off and understand the map symbols.
Safety Needs & Corresponding Strategies
A systemic approach identifies risk patterns across the network and treats many locations, improving equity, supporting Vision Zero and Safe System principles and improving safety. The crash type and contributing factors of a crash (ex. ran a stop sign or failure to yield right of way) help guide strategies to address these safety needs.
Click or tap on a card below to see potential safety strategies.
-
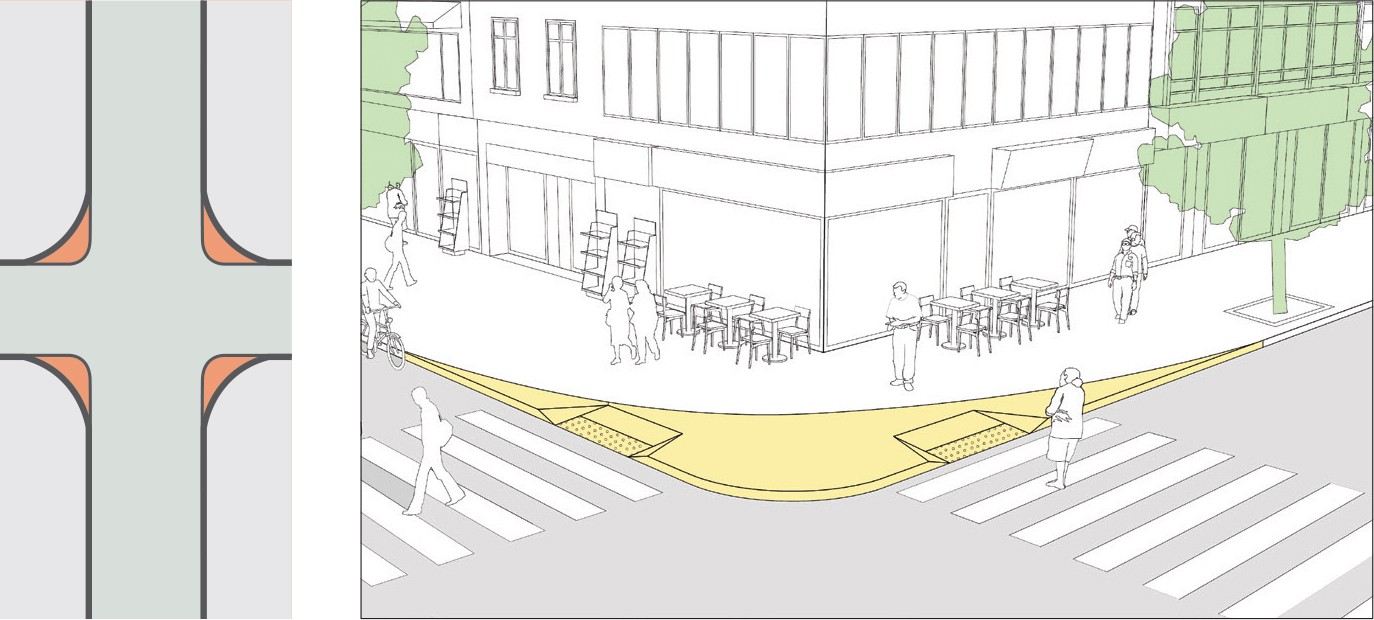
Left-Turn/Angle Crashes
-
Reduce curb radii
-
-
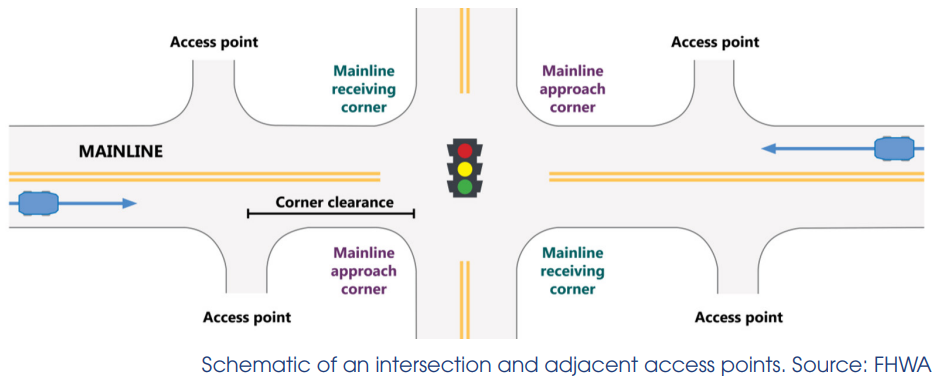
Rear End Crashes
-
Access management
-
-
Failure to Yield Crashes
-
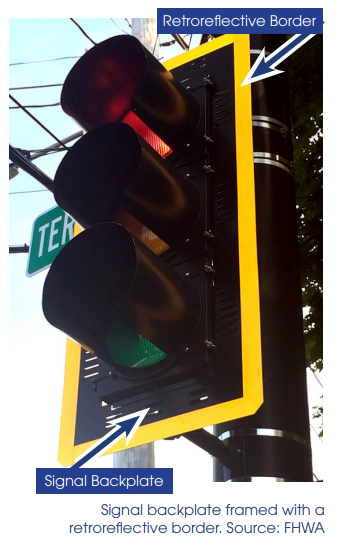 Signal backplates with retroreflective borders
-
-
Speed Related Crashes
-
 Automated speed enforcement cameras
-
Narrow travel lanes
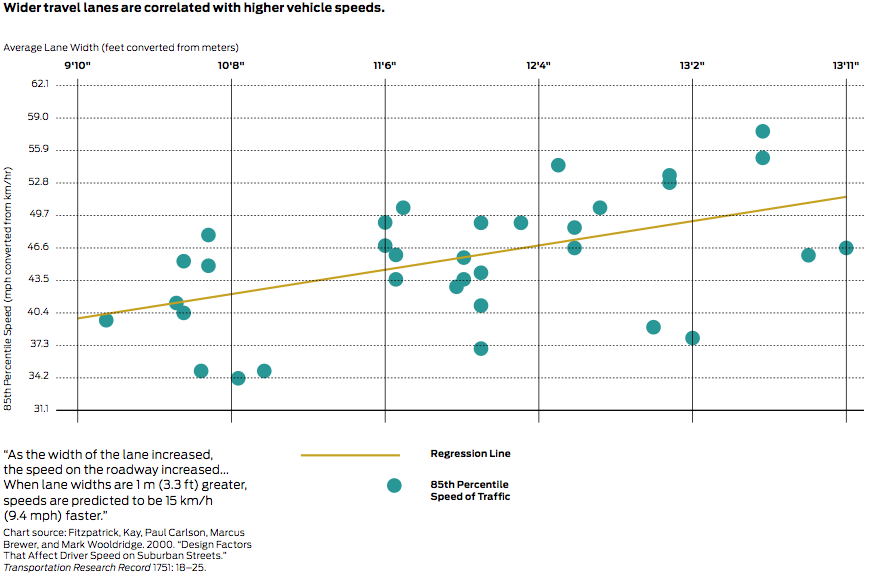
-
Traffic
Tempe’s street network functions as a multimodal system for moving people and goods, yet growing demands reveal gaps between system performance and community goals. Traffic delay reduction is a City Council priority, and the General Plan emphasizes retaining existing traffic capacity while the city works to reduce reliance on single-occupancy vehicles.
The roadway network represents a significant public investment that requires ongoing maintenance. Insufficient preservation can lead to declining performance, increased delays, and the need for costly, disruptive reconstruction. Addressing these needs requires balancing multimodal mobility, system efficiency, and proactive maintenance to sustain roadway capacity and reliability over time.
Level of Service
Level of Service (LOS) results describe how well a roadway operates from the perspective of drivers, based on factors like speed, travel time, delay, and comfort.
- A Free-flow conditions minimal delay
- B Stable flow with slight delays; still comfortable for drivers
- C Stable flow but noticeable congestion; speeds are somewhat restricted
- D High-density flow; delays are significant, and maneuverability is limited
- E Operating near capacity; very slow speeds and long delays
- F Breakdown conditions; severe congestion, stop-and-go traffic and excessive delays
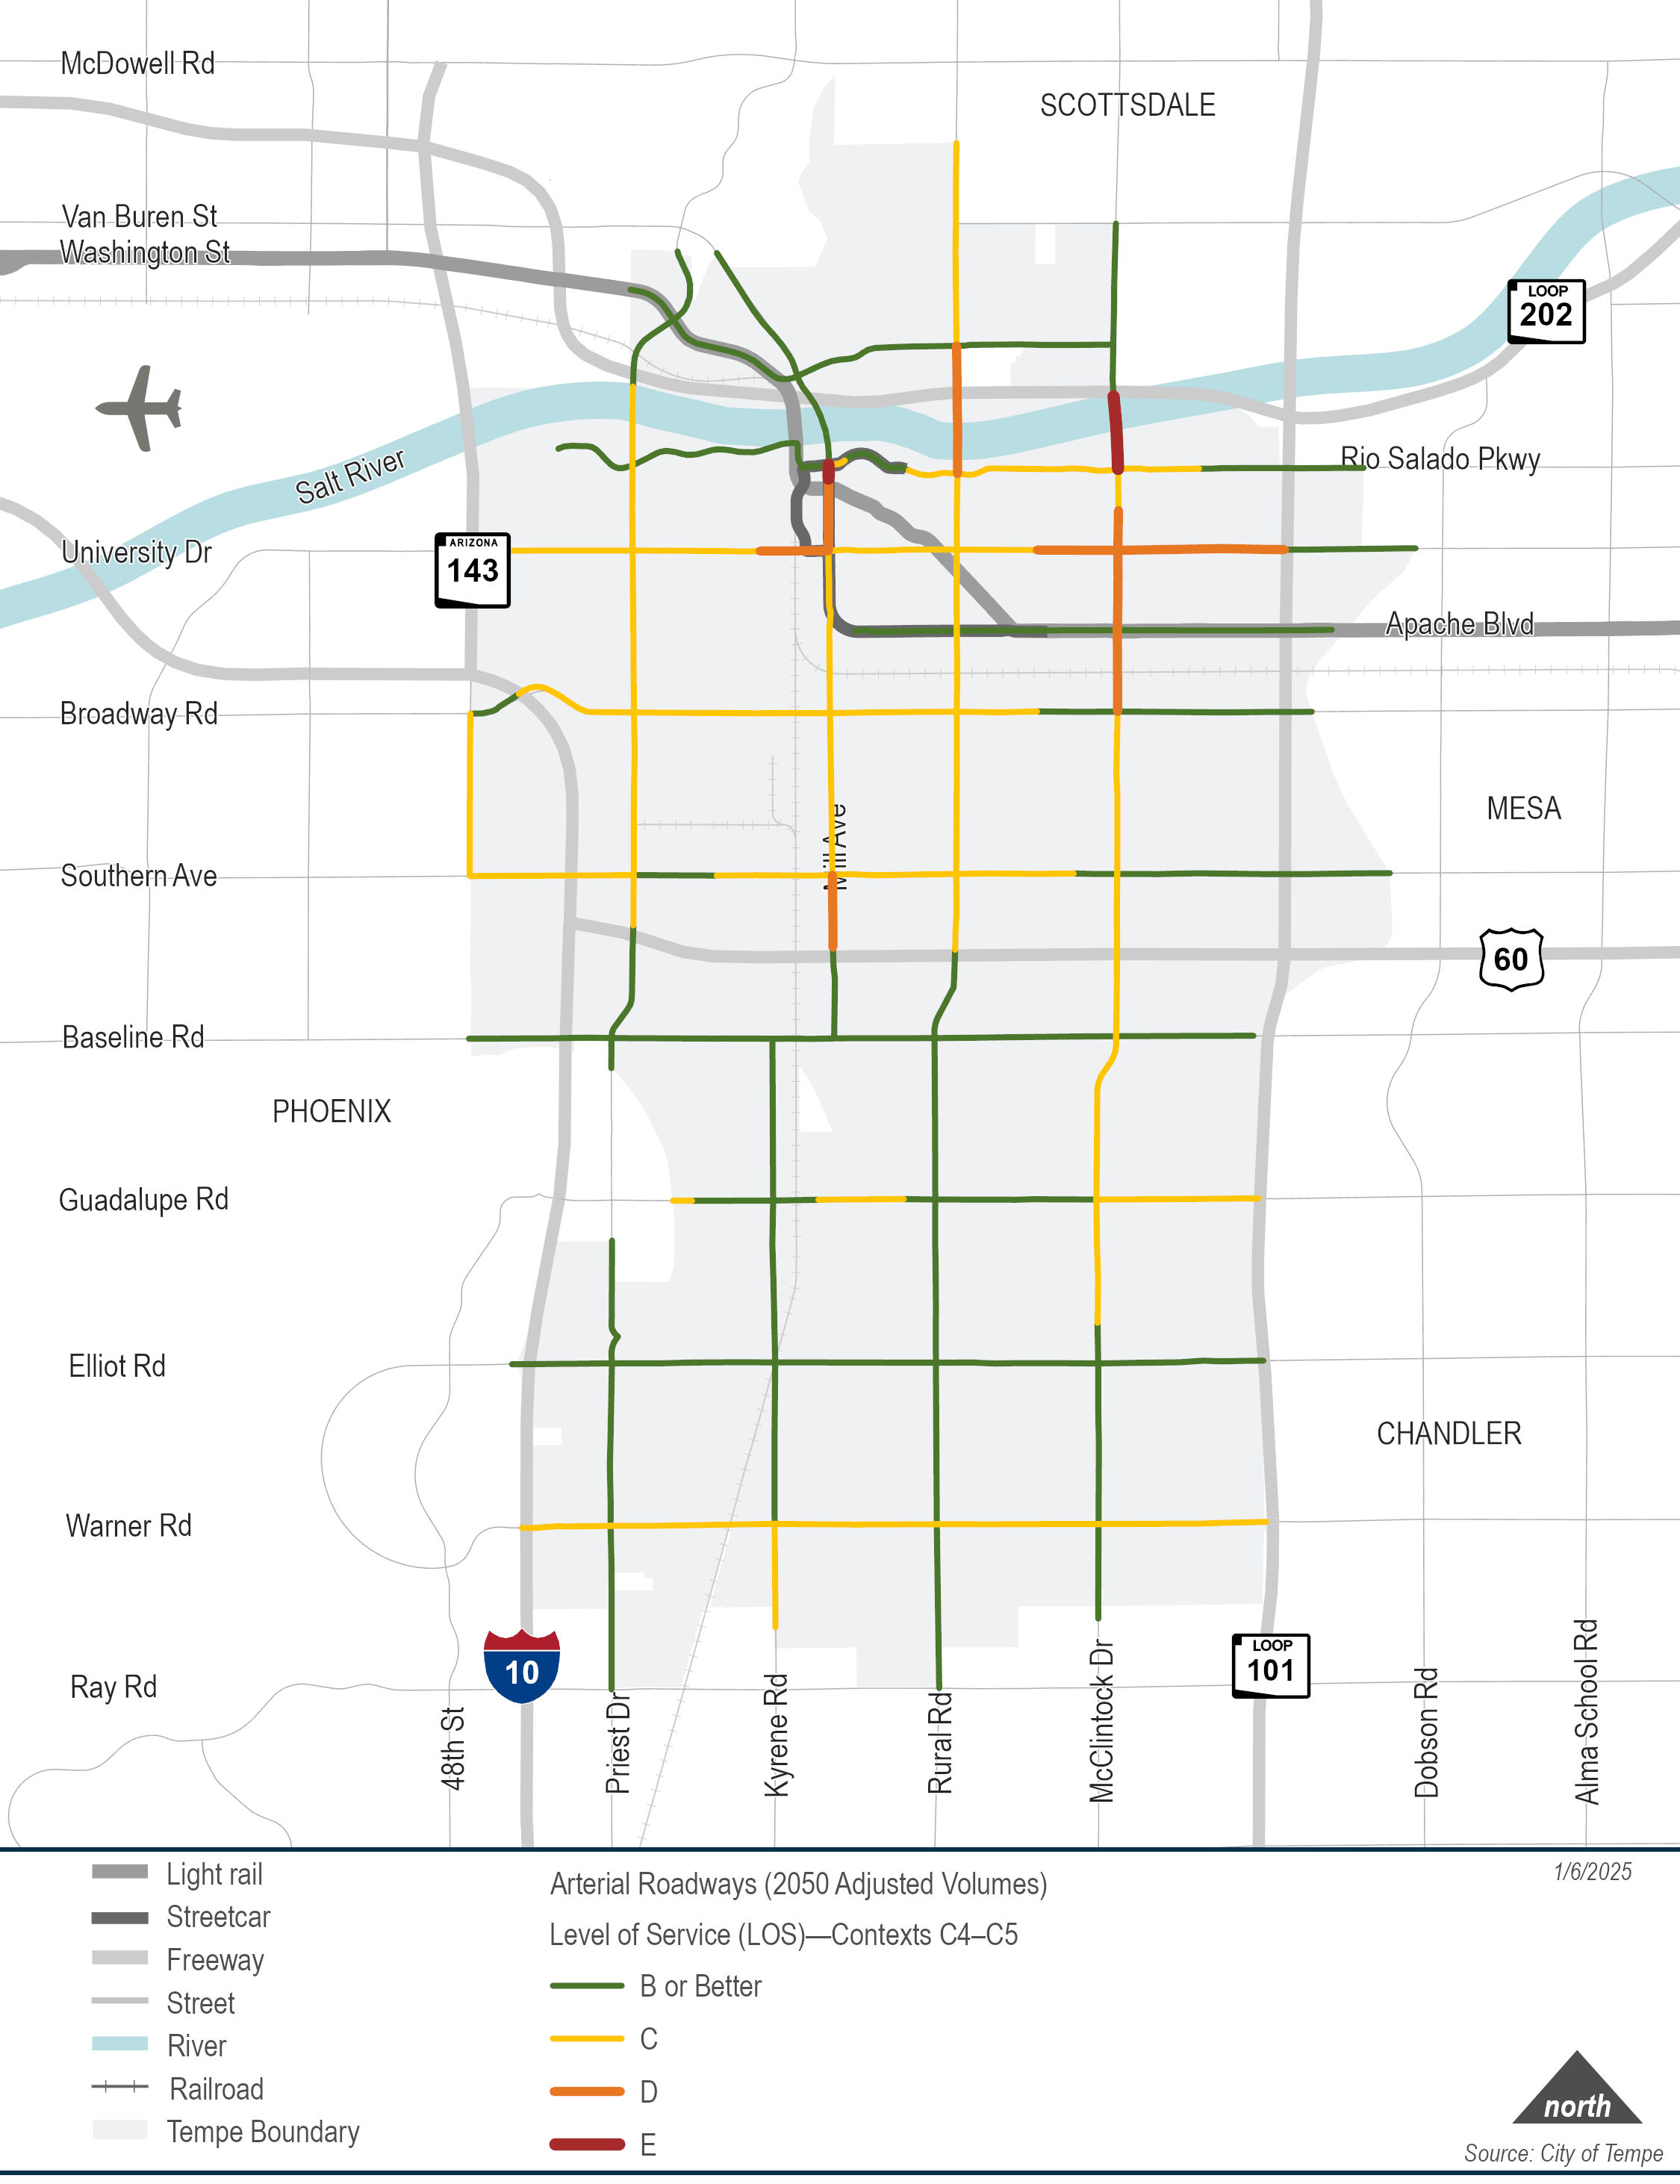
Move the slider left and right to view the projected change in levels of service between 2024 and 2050.
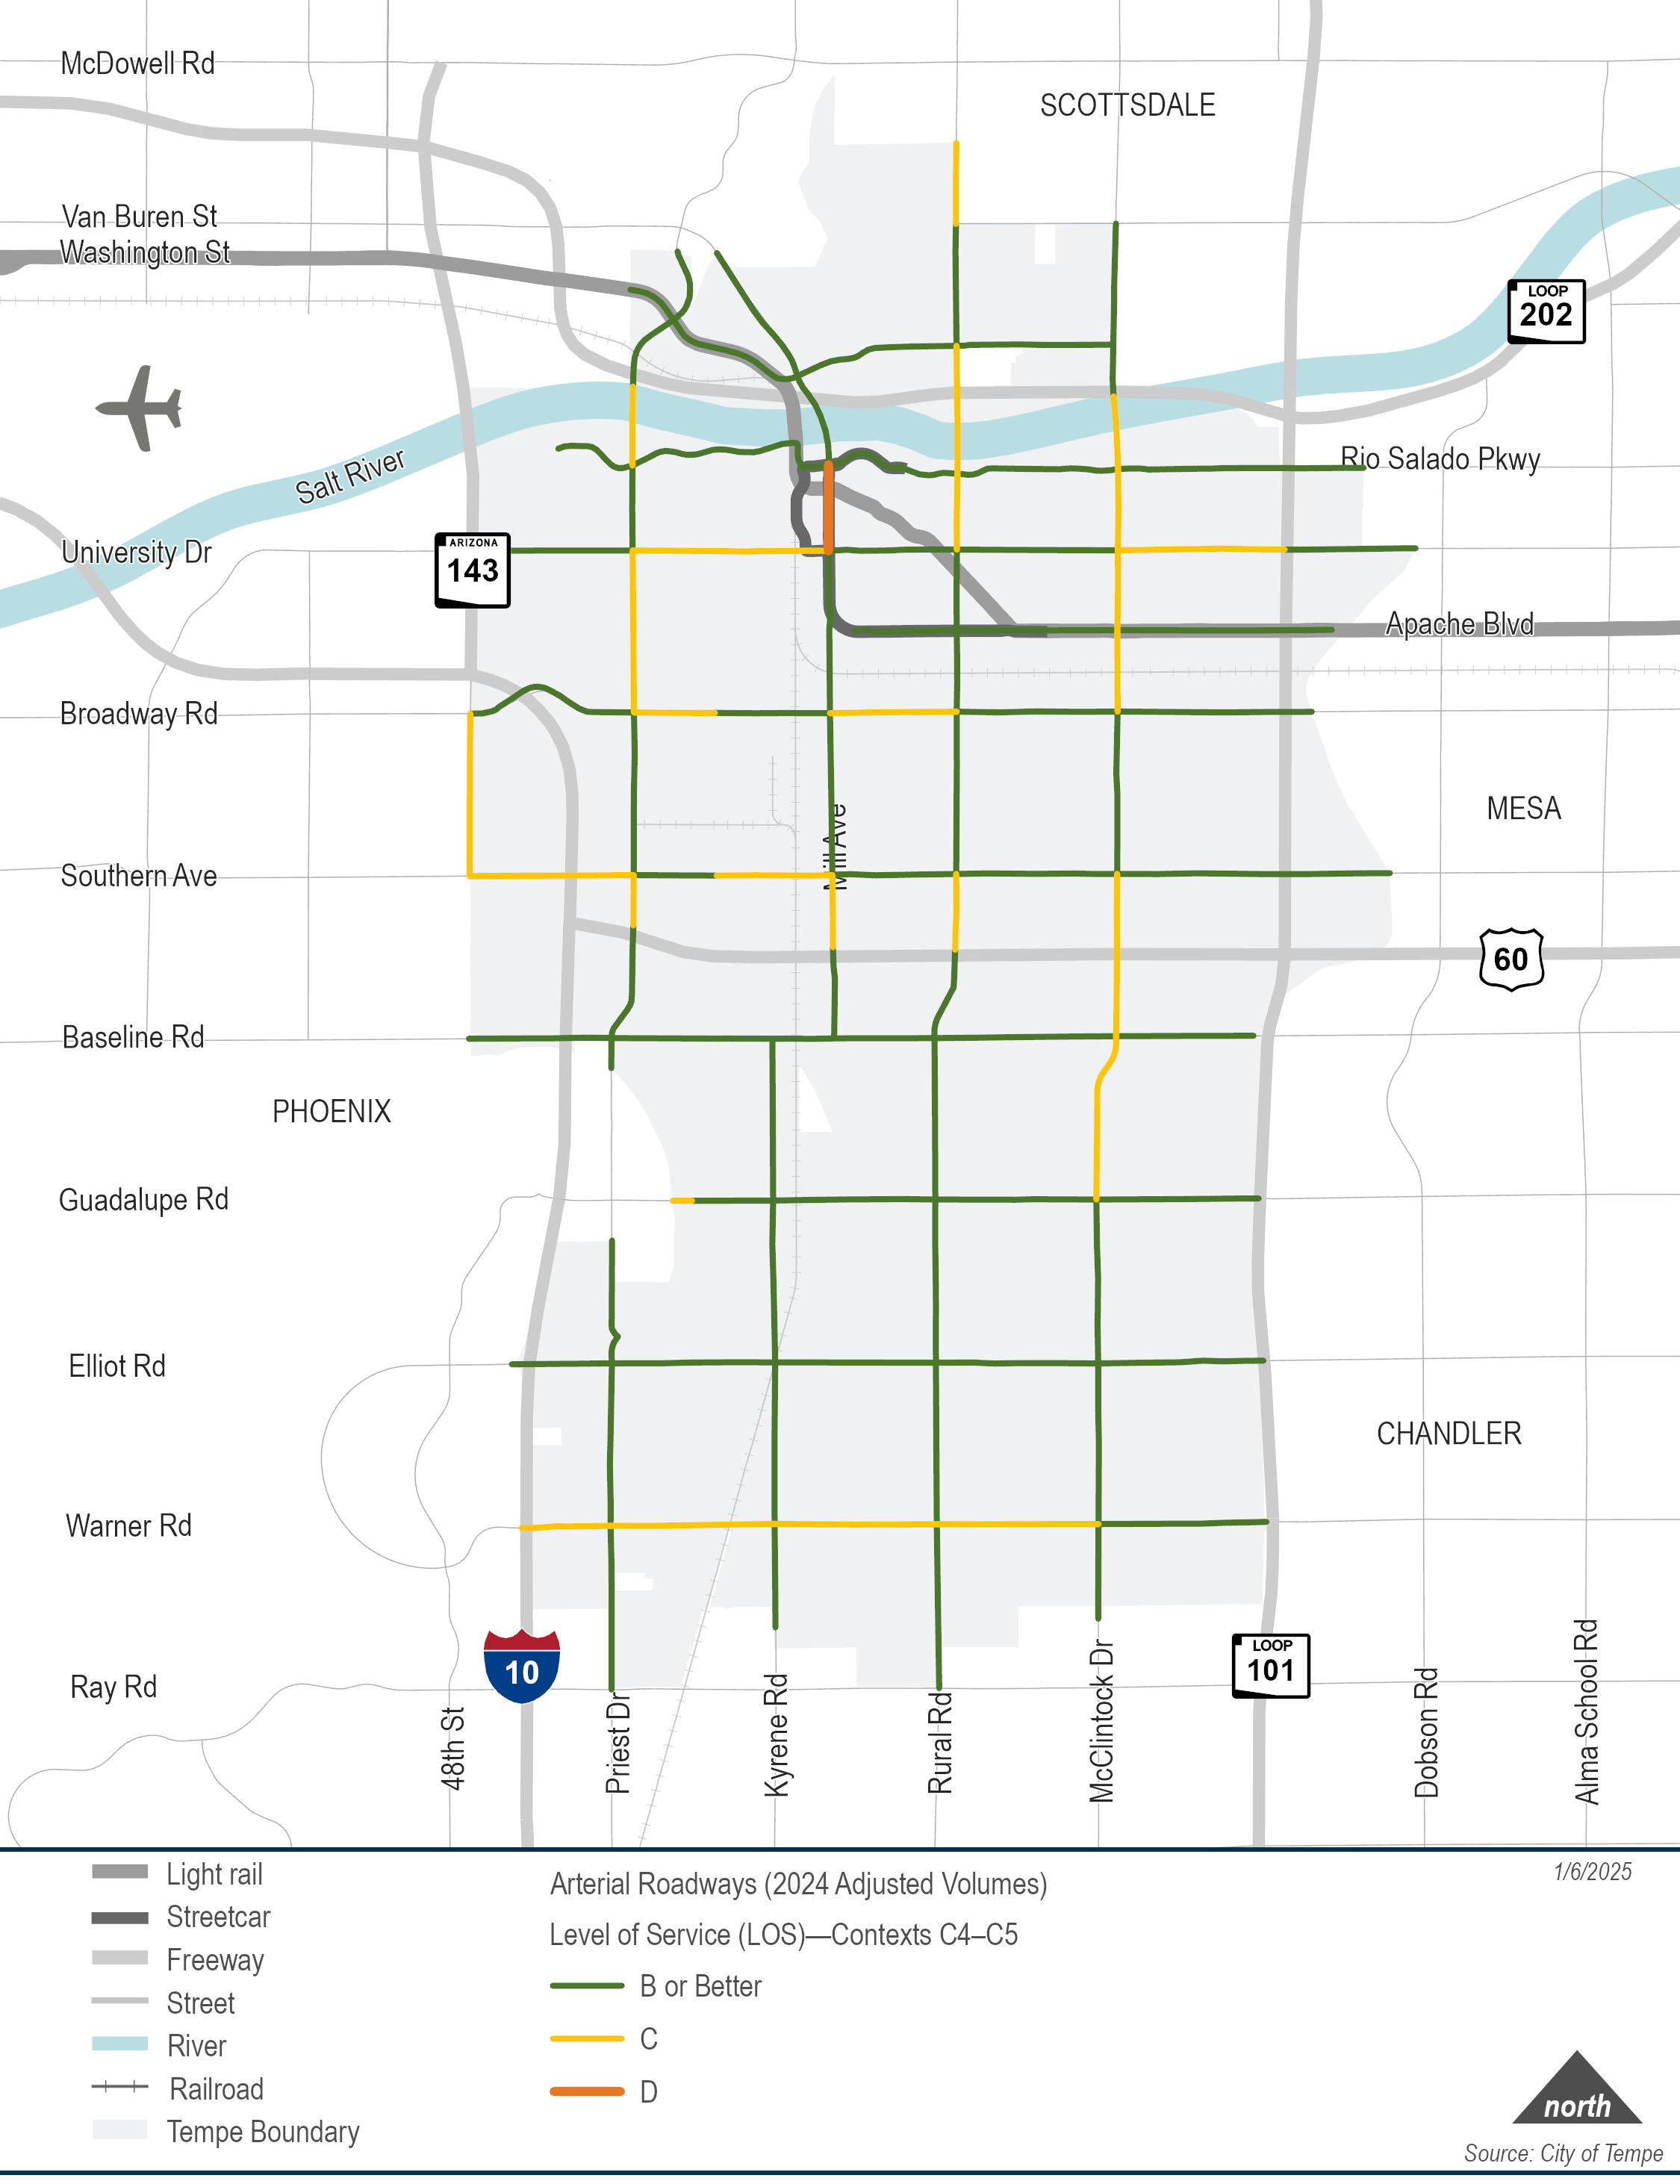
2024 traffic data shows the City’s streets operating at an acceptable LOS
2050 traffic projections show reduced traffic efficiency in areas
Active Transportation
Tempe’s community vision imagines neighborhoods that are walkable, pleasant, safe, and easy to get around. Places where daily needs are within a 20-minute walk, bike ride, or transit trip. This “20-minute city” approach supports a vibrant mix of homes, shops, and services close to where people live. To help make that vision a reality, the city is focused on creating safe, comfortable walking environments and better pedestrian connections that encourage people to travel on foot.
What is a 20 minute city?
A 20-minute city is characterized by a vibrant mix of commercial, recreational, civic, and residential establishments within a 1-mile walking distance, 4-mile bicycle ride, or a 20-minute transit ride.
A 20-minute city supports sustainability goals, reduces infrastructure and energy costs and initiates healthier living environment and healthier residents.
In 2014, the City of Tempe adopted this vision by the approval of the Tempe General Plan.
How We Identified Gaps
To understand where the Active Transportation Network is most disconnected, we conducted a Sidewalk Gap Analysis and a Pedestrian Crossing Analysis. These tools reveal where sidewalks are missing, where safe crossings are too far apart, and where these gaps create barriers for people walking, rolling, and accessing transit. This combined approach helps identify the highest-priority locations for improving comfort, safety, and connectivity.
Community feedback reinforces this need, with residents noting that some areas near new developments lack sidewalks or safe pedestrian space and expressing interest in more mid-block crossings to improve access and safety for people walking and biking.
Sidewalk Gap Analysis
The Sidewalk Gap Analysis identifies where sidewalks are missing along arterial and collector streets and helps prioritize improvements where they are needed most. Priority is given to areas with high transit use, locations within 300 feet of bus stops, and corridors near schools and parks.
Pedestrian Crossing Analysis
Many Segment High Injury Network corridors are wide, high-traffic streets with limited safe places for people to walk, roll, or bike across. Long distances between signalized intersections or marked crossings often force people to cross at unsafe locations. These gaps also make it harder for riders to reach nearby transit stops, creating barriers to comfortable, reliable access.
Explore the Active Transportation Gaps Map
Use this interactive map to explore sidewalk gaps throughout the city and long pedestrian crossing distances along the High Injury Network. Pan and zoom to navigate, click highlighted streets to view details. Use the Layers and Legend panels to turn data on or off and understand the map symbols.
Bicycle Network
The city is working to expand and improve the bicycle network to create safer, lower-stress routes that connect neighborhoods, destinations, and transit. Tempe’s community vision recognizes a city that is physically accessible by many ways of getting around - especially transit, walking, biking, and micromobility - and connected within a 20-minute trip. Expanding and enhancing bikeways across the city and the region helps make bicycling a safer, more convenient option for everyday travel, while also making streets safer for everyone.
How We Identified Gaps
To identify gaps in the bicycle network, the city reviewed the bicycle network to understand where routes may not fully support safe, comfortable, and connected travel.
- Safety analysis compared BIKEiT routes with the High Injury Network (HIN) to identify segments and intersections with a history of serious crashes or other safety concerns like inadequate bike facilities and inadequate crossings.
- Comfort was also evaluated by highlighting areas with high-stress riding conditions (Bicycle Level of Traffic Stress score 3 or 4), dropped bike lanes at intersection approaches, and limited separation from traffic, or a lack of shade that can make bicycling less appealing, especially in warmer months.
- Connectivity was assessed to find missing links and discontinuities in the bicycle network where routes do not fully connect neighborhoods, destinations, or other bikeways and where crossings of major roadways, freeways, and railroads are limited.
More than one-third of survey respondents said they would bike more if there were better separation from vehicles and more low-stress routes, and more than 14 percent already rely on bicycling as their primary way to get around. Survey respondents also noted that designing streets to support walking, biking, and transit improves safety and accessibility for all travelers, including people who drive.
Bike Safety
The bicycle network is intended to provide safe bike routes throughout Tempe but the High Injury Network data suggests safety issues and a need for improvements at several intersections and mid-blocks.
View the interactive map to see the Bicycle Level of Traffic Stress along bicycle network routes.
Bike Comfort
The bicycle network is designed to provide low-stress bicycle routes throughout Tempe. We applied the framework which evaluates factors such as bike facility type and width, traffic volumes, speed limits, and on-street parking. This analysis helps identify where improvements to existing bikeways are needed and where new low-stress routes could expand the network.
View the interactive map to see the Bicycle Level of Traffic Stress along bicycle network routes.
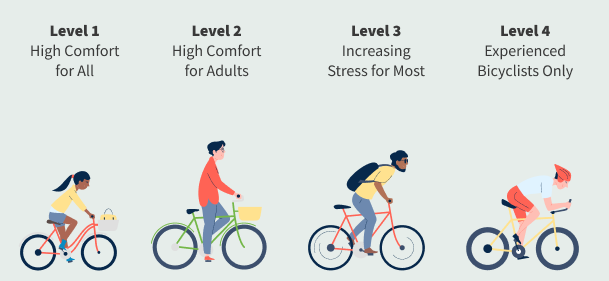
Bicycle Level of Stress (LTS)
Bicycle Level of Traffic Stress is based on nationally-recognized research to rank streets and multi-use trails.
Most people interested in biking feel comfortable on lower-stress facilities. Only more confident bicyclists feel comfortable riding on high-stress facilities.
Bike Connectivity
A well-connected bicycle network depends on safe and comfortable crossings of major streets, freeways, and rail lines, as well as continuous low-stress routes that remain connected through intersections and mid-block crossings where needed. While the city has many corridors with dedicated bike lanes, some end at or near intersections without connecting to other routes, which can leave less confident riders stranded, increase exposure to traffic conflicts, and create unclear expectations for both cyclists and motorists.
View the interactive map to see where bike lanes are discontinuous in the existing network.
Explore the Bicycle Network Gaps & Needs Map
Use this interactive map to explore safety, comfort, and connectivity gaps in the bicycle network. Use the Layers and Legend panels to turn data on or off and understand the map symbols.
Transit Network
To support this vision of being a city that is physically accessible by many ways of getting around, the city is focused on coordinating efficient, safe, convenient, and interconnected transit options that serve both local and regional travel needs and support existing and future ridership.
Community input also reinforces the importance of this work, with residents noting that accessible and affordable public transit plays a key role in expanding opportunity and supporting upward social mobility.
How We Identified Gaps
To understand the gaps and needs in the transit network, we reviewed Composite Transit Propensity - a review of demographic variables to illustrate potential transit demand, the frequency gaps in the existing transit network, and on-time performance. Areas with high-frequency transit are mostly focused north of US 60 and weekday midday service is lacking throughout the city. As it relates to on-time performance, there is overlap in areas with high boarding activity and high performance issues.
Survey respondents noted that factors like improved speed, expanded destinations, improved bus stop amenities, and improved reliability of service would increase transit ridership.
Transit Frequency
The analysis shows unmet transit demand for midday frequent service network on Local Bus Routes.
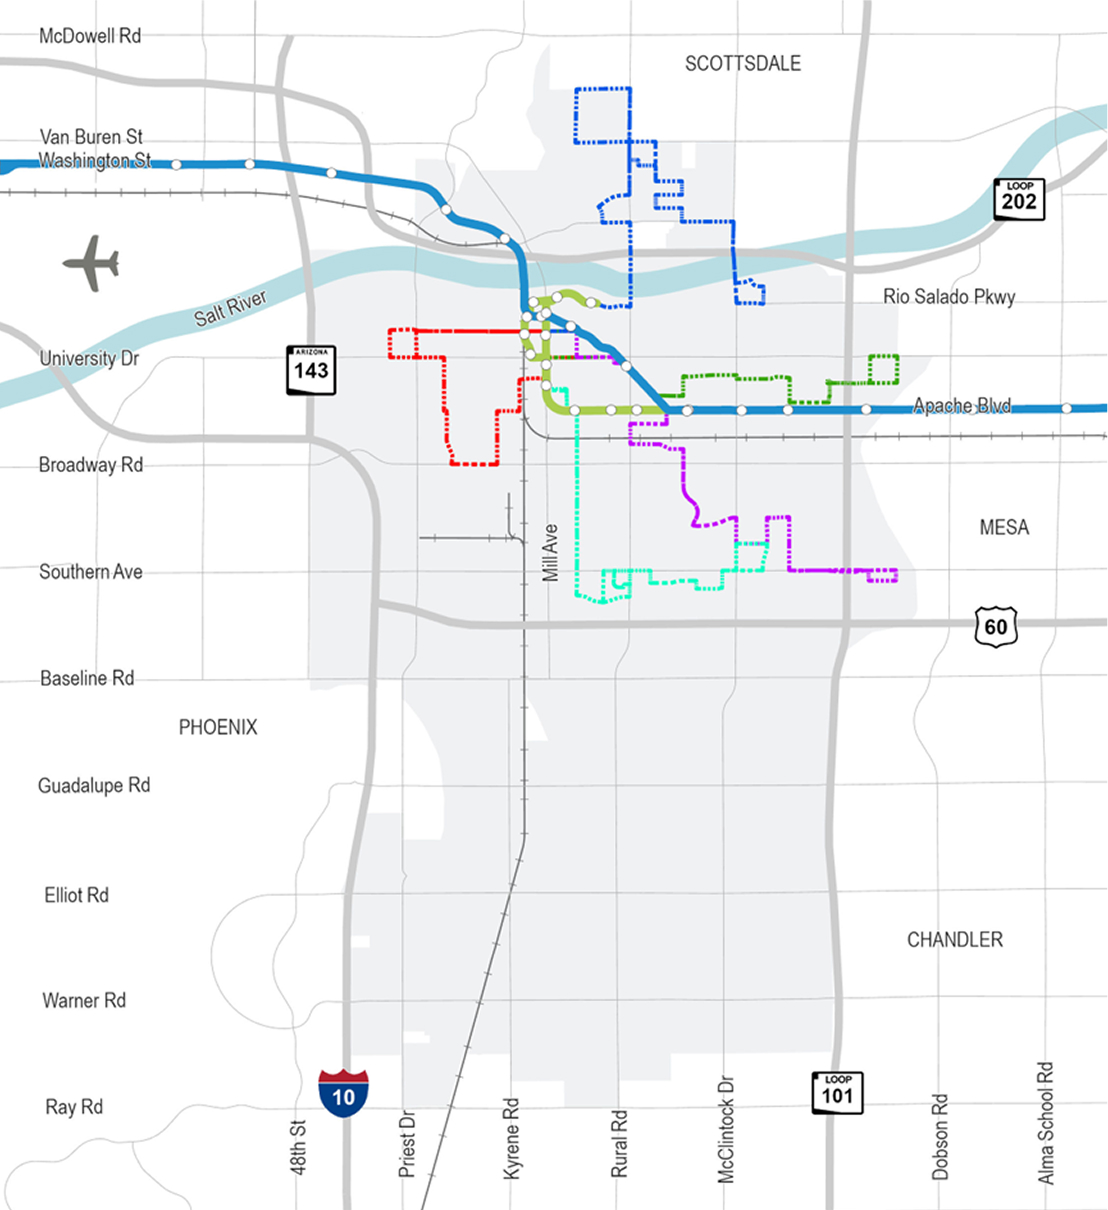
Explore transit frequency at-a-glance with the buttons below. Each map shows the level of frequent service during different times of day and days of the week.
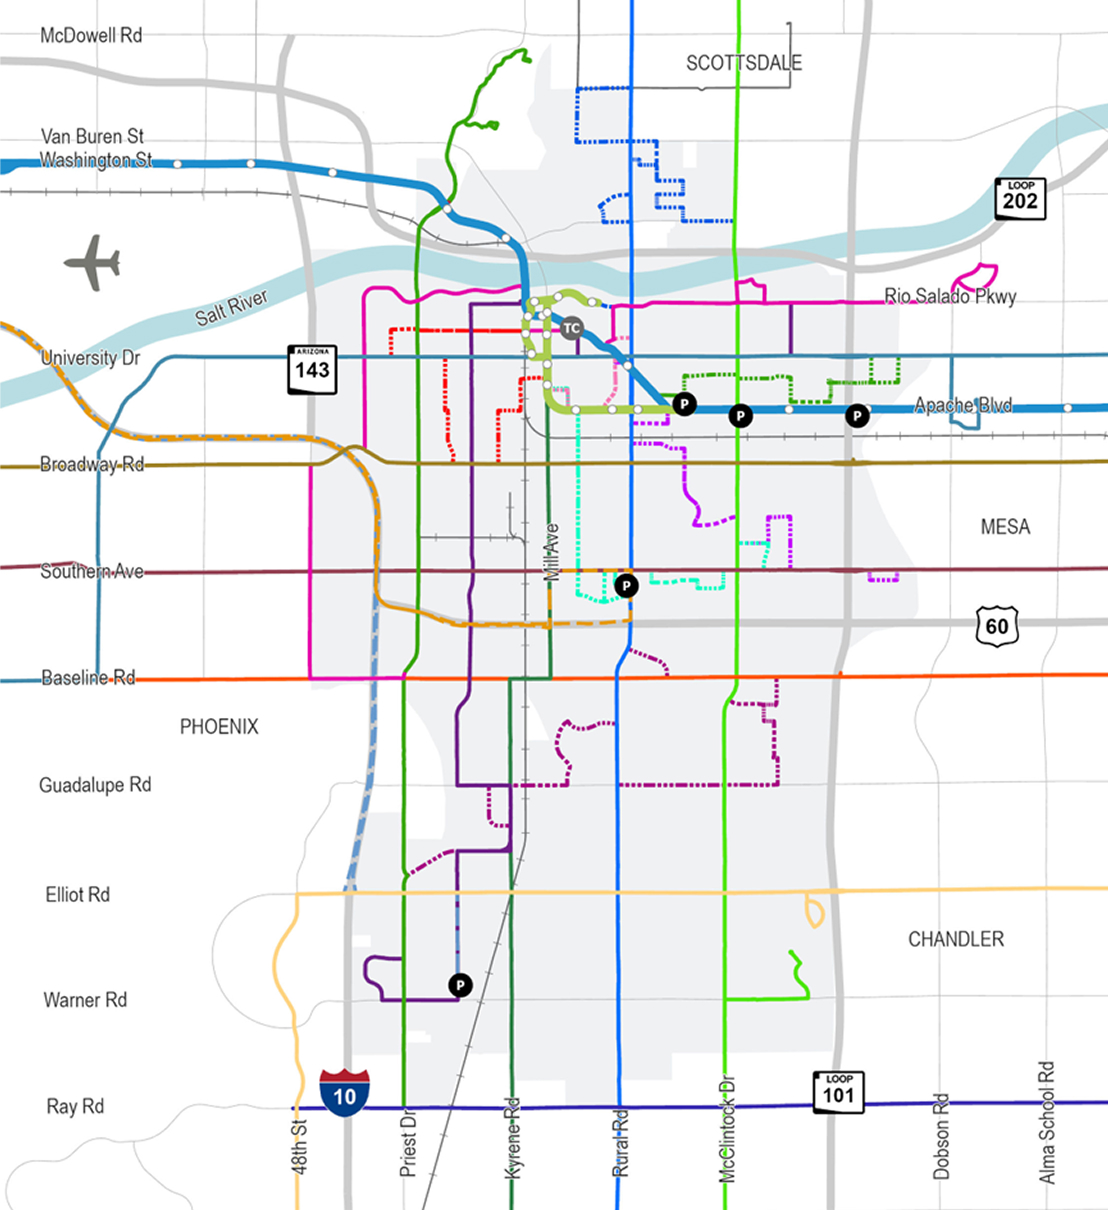
This map shows the existing transit network which includes rail (light rail or streetcar), circulators (Orbit/Flash), and select local bus routes. The following maps in this slideshow show the system’s Frequent Service (15-minute peak frequency or better) during the noted time periods (weekday peak, weekday off-peak, Saturday and Sunday)
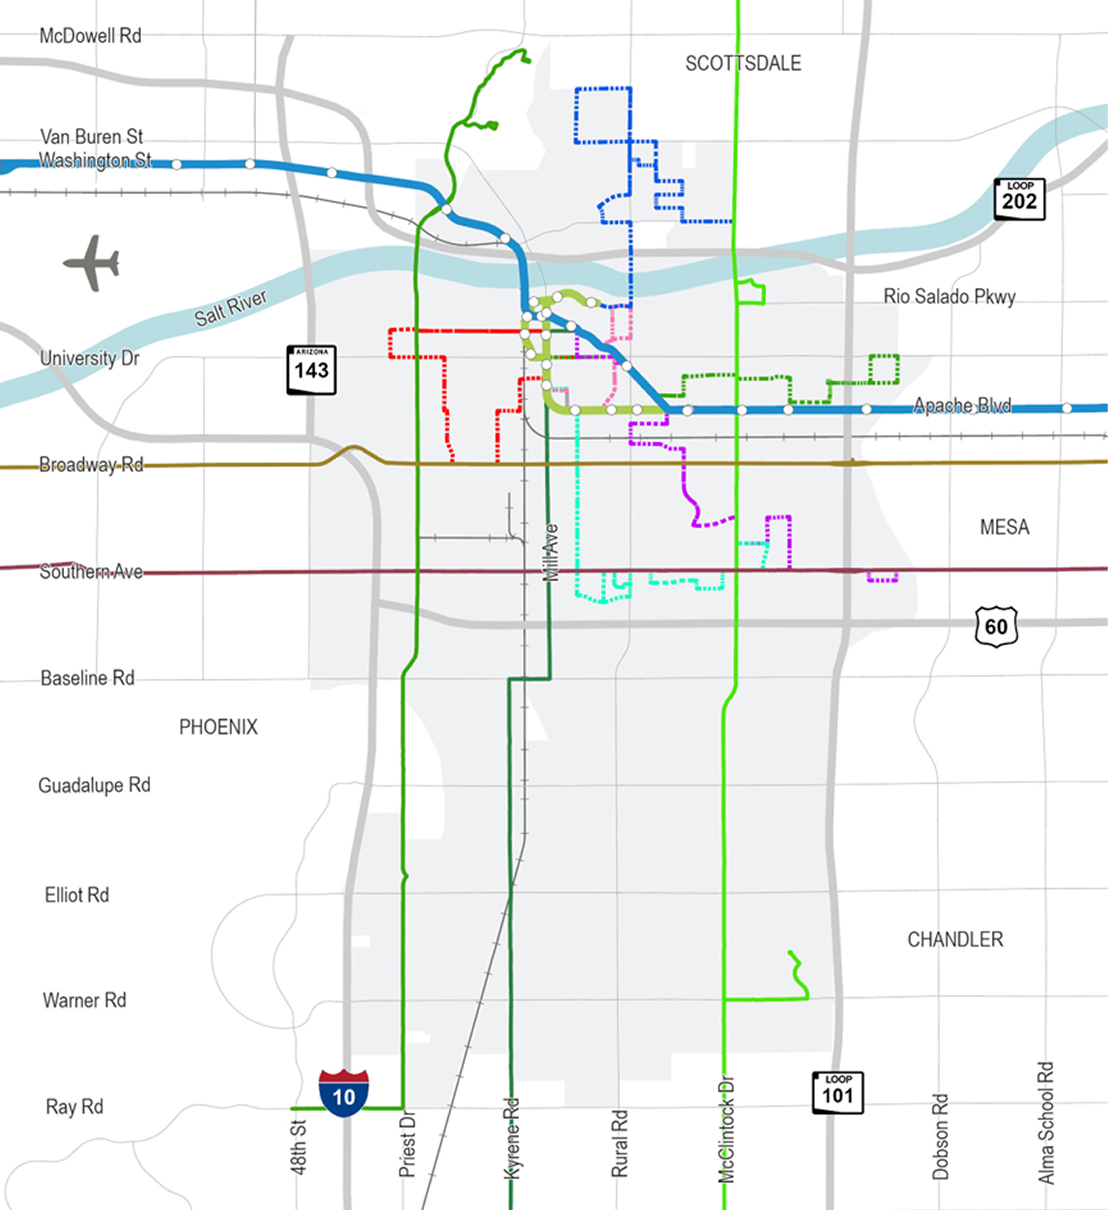
This map shows Frequent service: weekday peak (Monday - Friday)
This map shows Frequent service: weekday off-peak (Monday - Friday)
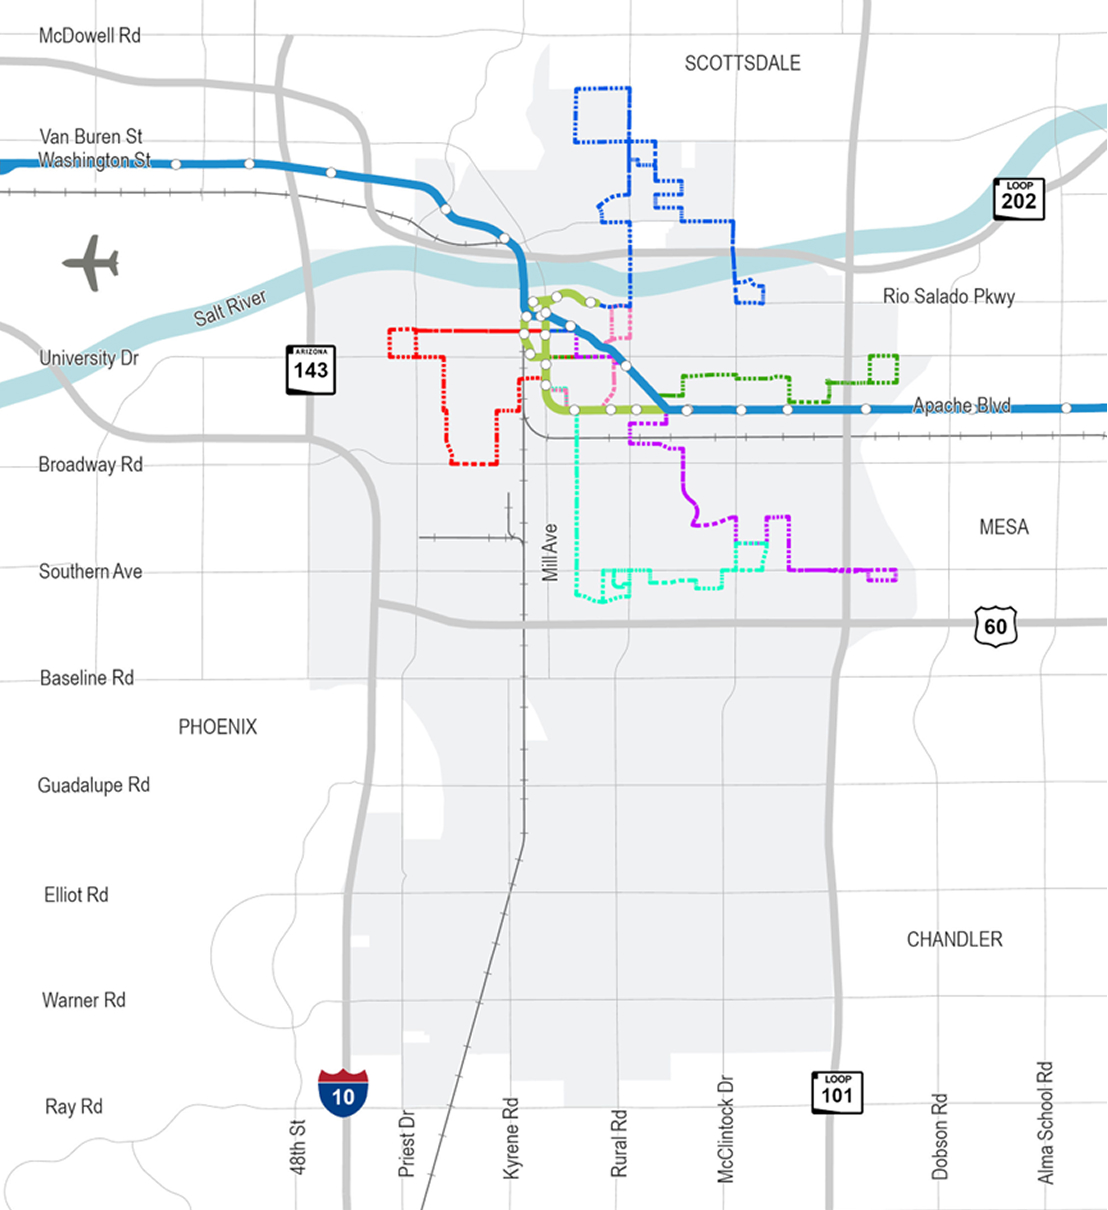
This map shows Frequent service: Saturday
This map shows Sunday Frequent Service.
Transit Performance
The analysis shows that the highest transit performance is generally north of the US 60 and there is often a direct correlation between transit performance and frequency provided.
Explore transit performance (boardings) with the buttons below.
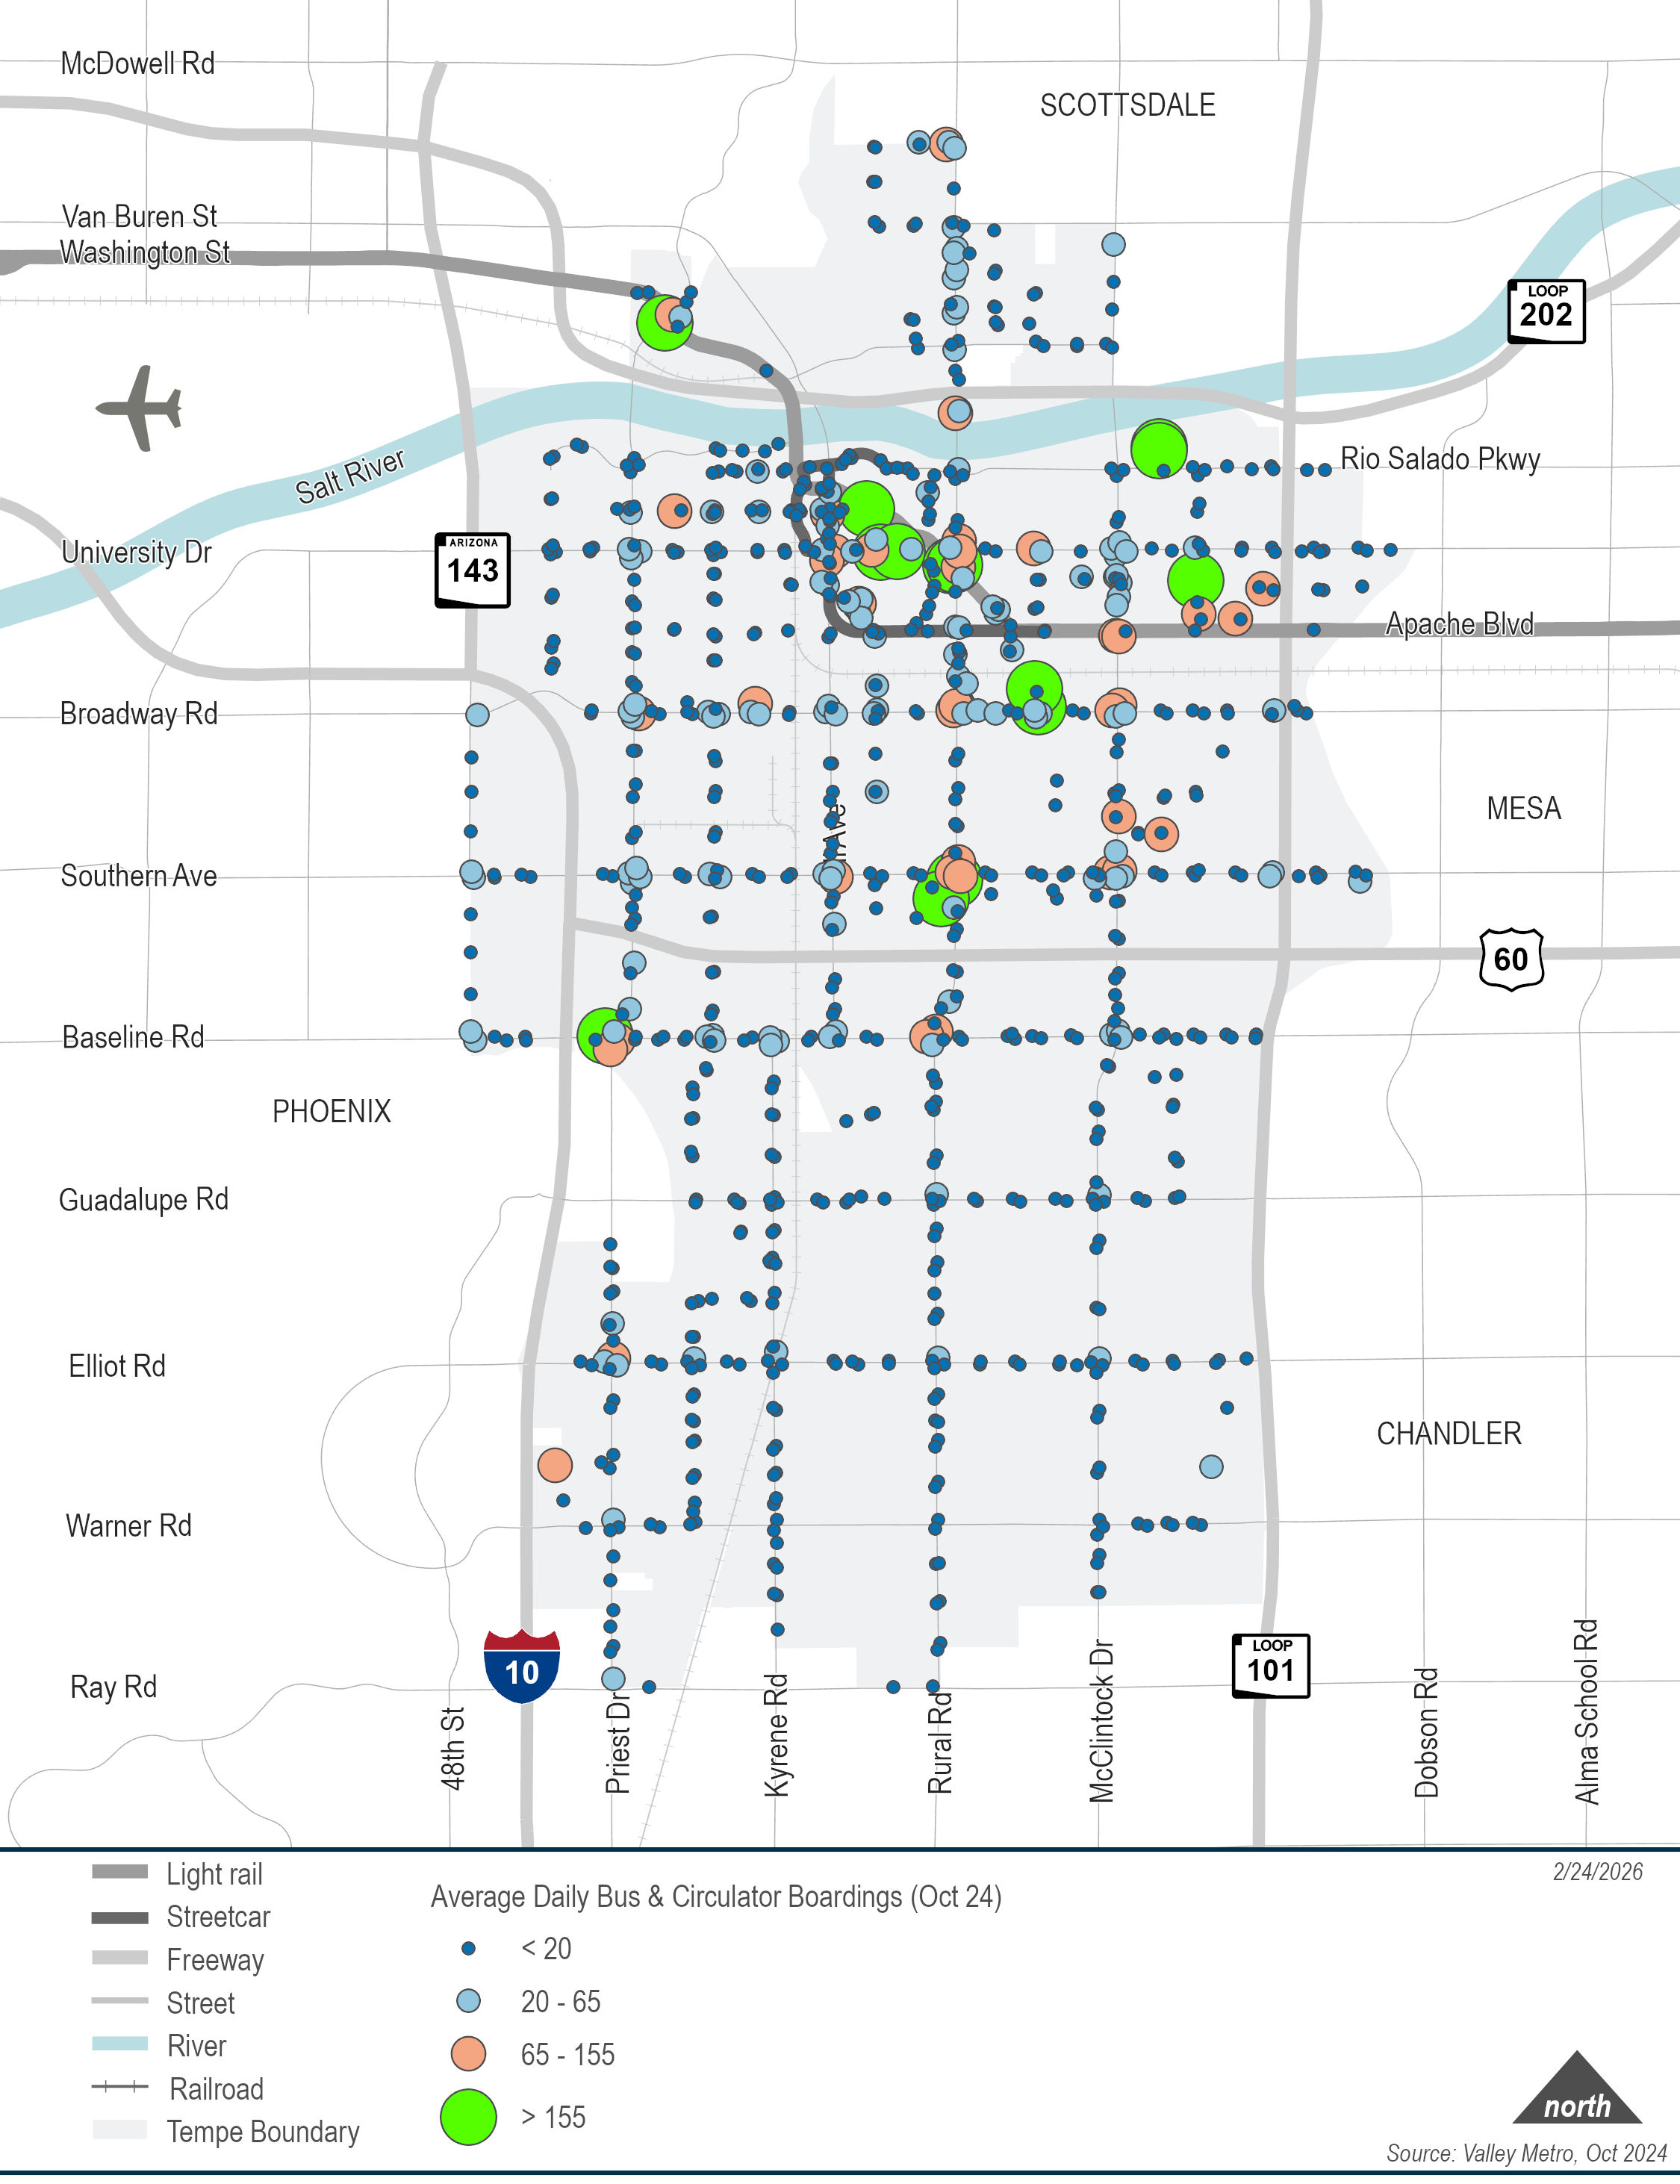
This map shows Daily Bus and Circulator Boardings.
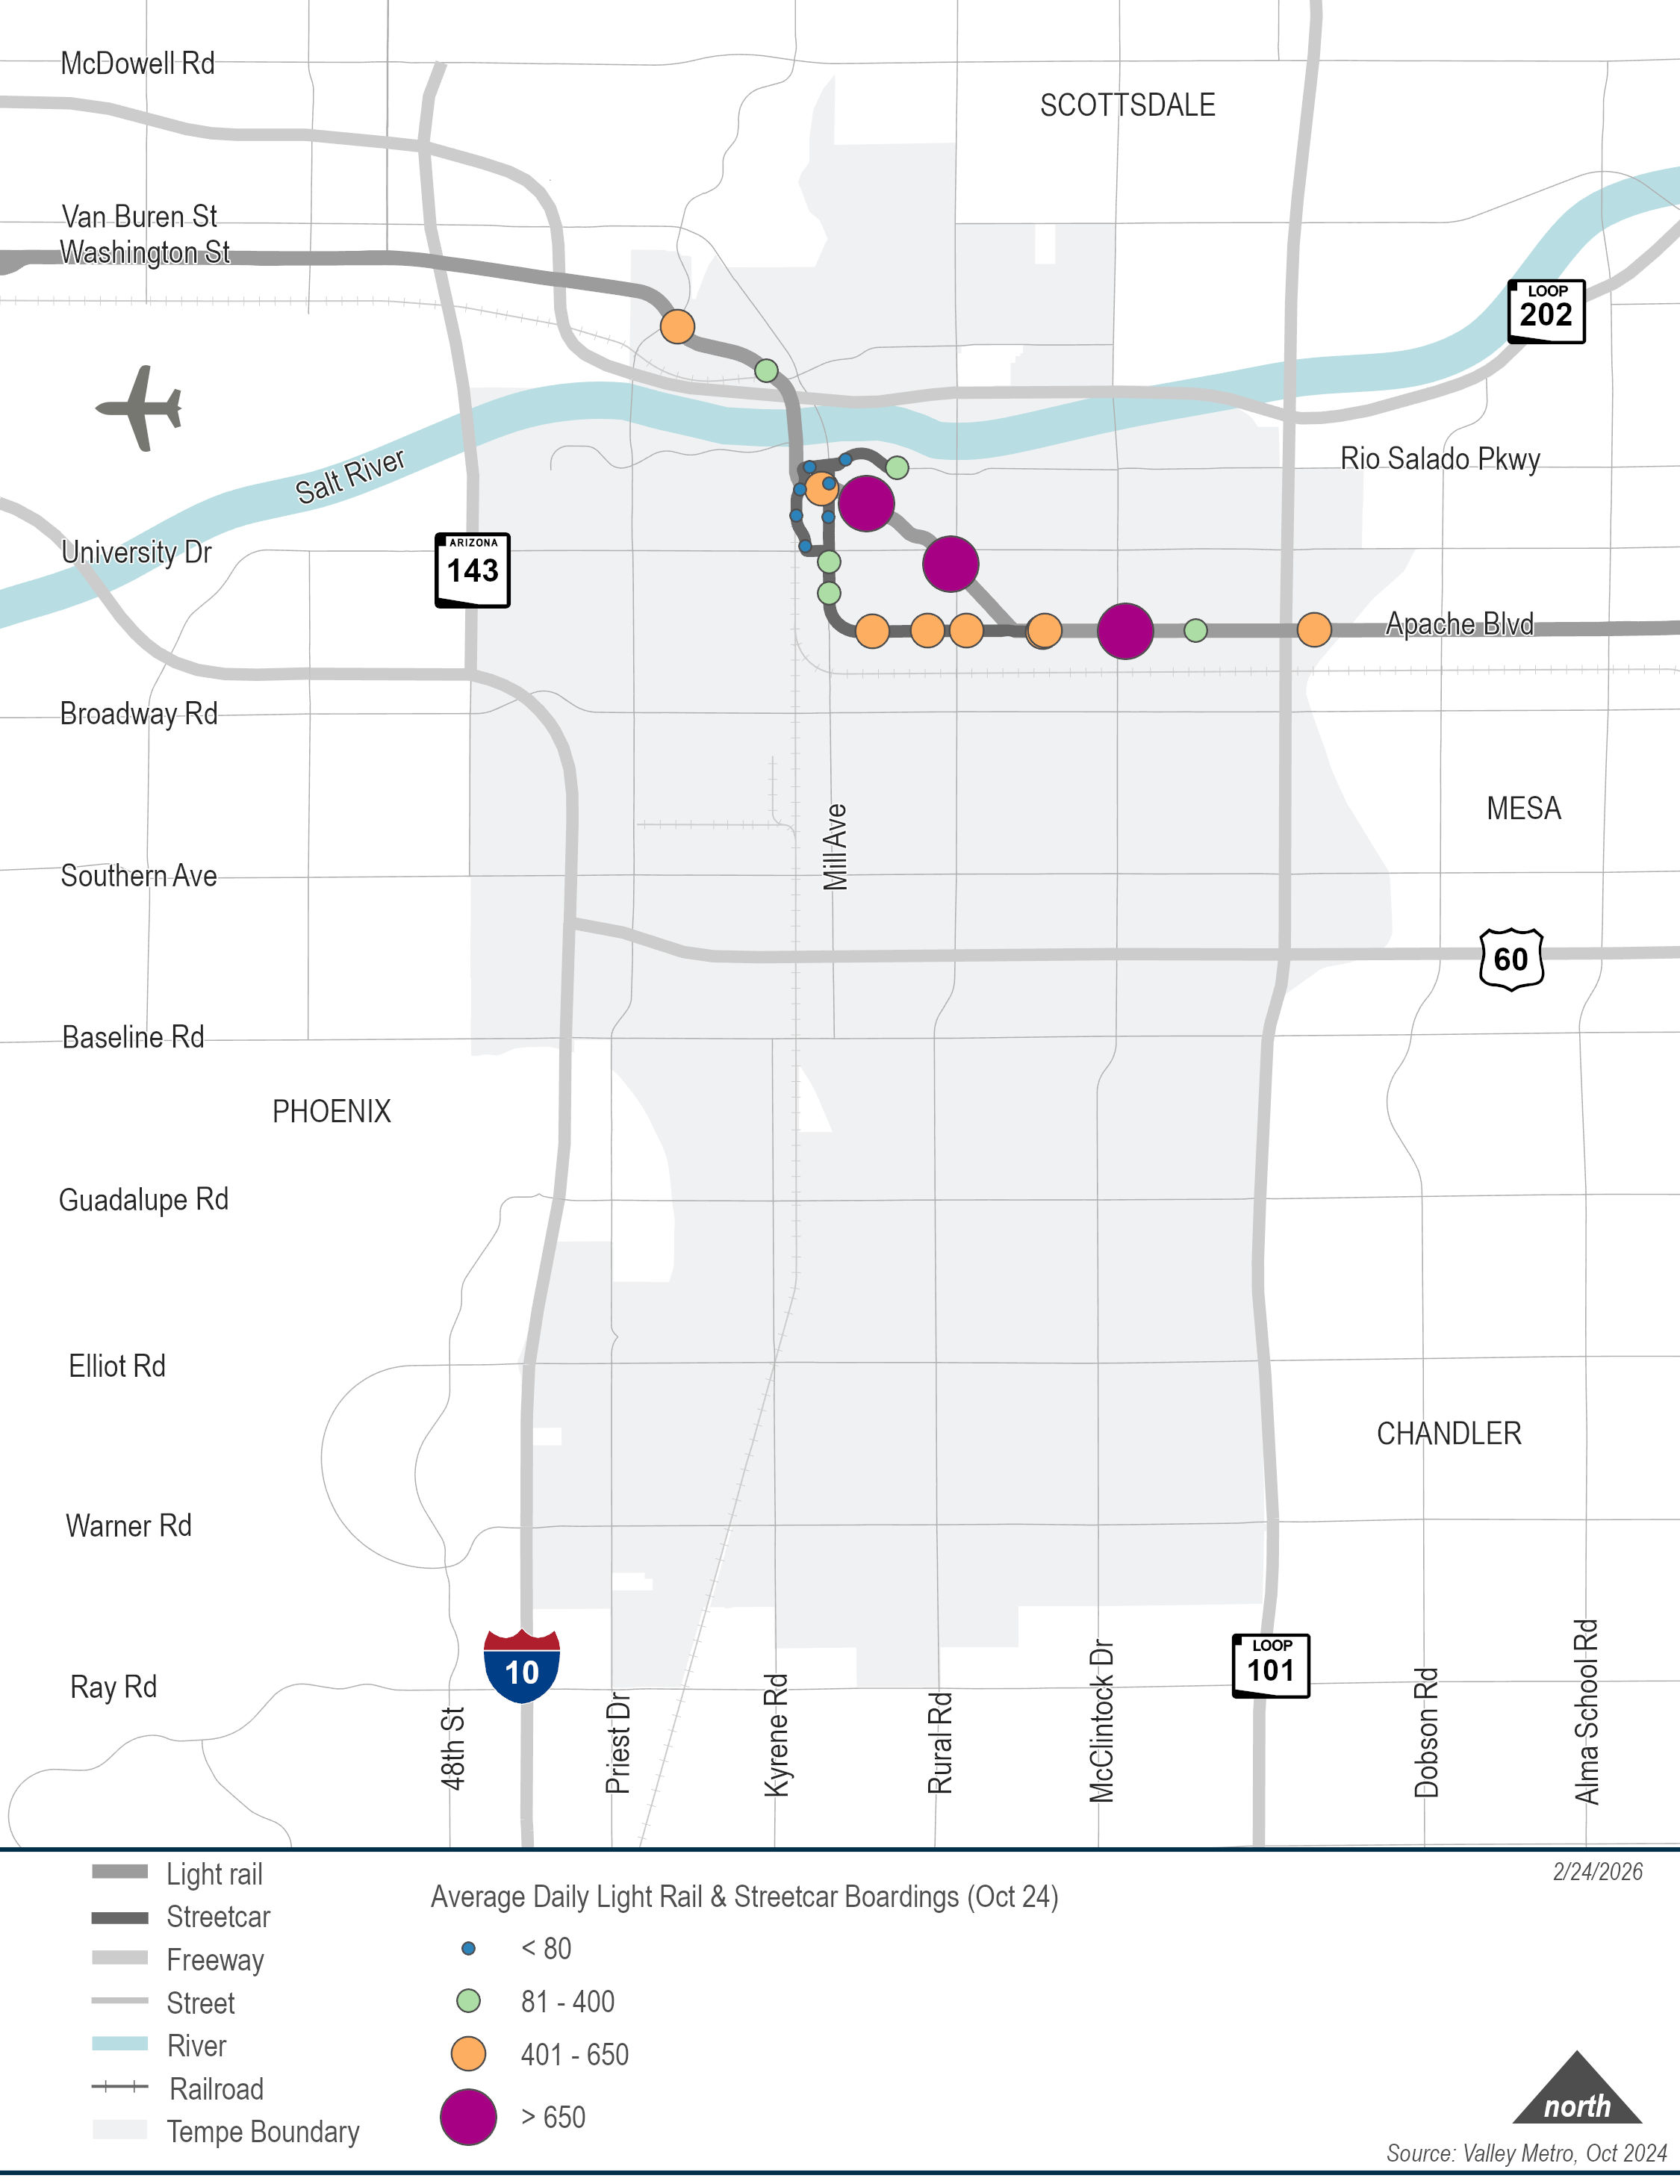
This map shows Daily Light Rail and Tempe Streetcar Boardings.
Explore the Transit Network Gaps & Needs Map
Use this interactive map to explore safety, comfort, and connectivity gaps in the bicycle network. Use the Layers and Legend panels to turn data on or off and understand the map symbols.
Policy Considerations
In addition to infrastructure improvements, the city is considering several policy areas that can influence transportation safety, operations, and user experience. These include speed limits, signal operations such as left-turn arrows and flashing yellow arrows, regulations related to motorized bicycle use, management of shared active transportation vehicles, and policies governing right turns on red. Evaluating these topics helps identify opportunities to address gaps, improve safety for all roadway users, and helps city policies keep pace with evolving travel patterns and technologies.
Evaluation Criteria
To better understand how future improvements will shape the City’s transportation network, each proposed project is evaluated for its potential impact on people walking, biking, and using transit. Using both qualitative insights and quantitative data, the City measures how effectively each project advances our transportation goals. This balanced approach supports decisions reflect community priorities as well as technical performance.
Projects are reviewed through nine key evaluation criteria, developed through planning and public outreach. These criteria provide a clear and consistent framework to identify the improvements that will deliver the greatest benefit to residents, visitors, and the broader transportation system.
- Traffic Safety: Address the High Injury Network.
- Bicycle/Pedestrian Connectivity: Enhance bike and/or pedestrian access.
- Community Support: Use survey results to help inform decision making.
- Traffic Congestion: Optimize corridor operations or reduce congestion.
- Right-of-Way: Address property and access impacts.
- Costs: Planning-level estimates.
- City Goals: City Council Priorities.
- Mode Split: Improve or add new mode choices.
- Equity: Environmental Justice geography.
Share Your Thoughts
Your input is important to us. Complete the Gaps and Needs Survey to help us better understand where you see a need to improve our transportation system, or to highlight gaps in that service. Completed surveys are requested by March 18, 2026.
Next Steps
Using the information identified and the feedback received through this latest phase of work the study team will begin drafting the Plan. We’ll update the website with draft Plan recommendations in Spring 2026.